
Controversial_Ideas , 5(3), 5; doi:10.63466/jci05030005
Other
Refugees’ Intelligence: Response to Comments, Suggestions and Criticism
Department of Psychology, Chemnitz University of Technology, Germany; heiner.rindermann@psychologie.tu-chemnitz.de
How to Cite: Rindermann, H. Refugees’ Intelligence: Response to Comments, Suggestions and Criticism. Journal of Controversial Ideas 2025, 5(3), 5; doi:10.63466/jci05030005.
Received: 27 February 2025 / Accepted: 18 October 2025 / Published: 11 November 2025
Abstract
:In “Intelligence of refugees in Germany”, we (Rindermann et al., 2024) proposed both a main and a secondary claim: 1. The average IQ scores for refugees in Germany is between 85 and 88. 2. An analysis of possible causes of these results within the refugee sample (i.e., differences within the group) revealed correlations with individual and country-of-origin average educational levels, with wealth, and with the background factors of culture and ancestry. In the same issue in which our article was published, the Journal of Controversial Ideas published critical commentaries on the article. The IQ scores were not criticized, but questions were raised about how this result can be explained and whether the correct methods were used. For example, the selection of indicators for genetic ancestry (formerly referred to as “evolution”) was criticized. If other indicators (genetic distances to South Africa or Ethiopia) are chosen, the results remain robust (for individual BOMAT-IQ r = .29 vs. .22/.28, for country level r = .67 vs. .57/.77). It was claimed that a factor analysis with two items to determine a g-factor would be incorrect. I disagree; in my view, the method is valid, but it offers no advantage over simple averaging. It was also said that the path model showed warnings and therefore produced erroneous results. This was due to the fact that too many paths were estimated relative to the number of countries. If one variable and its paths are removed, the pattern of results remains largely robust for the others (but the direct effect for country IQ on individual IQ increases from βCA = .36 to βCA = .79). Commentaries also argued that the intelligence level of refugees is not a sound reason against helping them. We did not claim that it is. However, we point out in this response that the legitimate interests and rights of the local population must also be taken into account. The burdens and sacrifices that migration entails for host societies must be recognized, acknowledged and included in an ethical evaluation.
Keywords:
refugees; immigrants; IQ; factor analysis; path model; immigration ethics1. What the Article Was About
In the study “Intelligence of refugees in Germany” we (Rindermann et al., 2024) examined the cognitive ability level of migrants (mostly “refugees”) using a figural, culture-reduced test and compared the result with that of two other samples. Depending on the norms applied, the average result is between IQ 85 and IQ 88. Refugees’ cognitive abilities are thus about 5 to 10 IQ points above the average abilities of people in their home countries, but 12 to 15 IQ points lower than the German average.
We also tried to analyze the results for their validity and for possible causes of the differences within the migrant group (e.g., the differences between refugees from Eritrea, Syria and Ukraine). Correlations with personal educational level (rather higher than usual, r = .41) or parental education (r = .33) and number of books at home (r = .33) supported the validity of our results. It was also observed that individual predictors (such as the refugee’s own education) are more informative for individual intelligence than country-of-origin-related predictors (multiple R = .50 vs. .34). However, when individual predictors are missing, country predictors are useful. In particular, country-specific mean values for refugees (country-specific mean IQs in the BOMAT test of refugees in Germany used in the study) can be very well predicted from country-of-origin-related predictors (country-of-origin education r = .86, cognitive ability around r = .70). We found that individual and country-level years of education, country-level cognitive ability (measured by student assessment or psychometric intelligence tests), country-level GDP per capital, cultural factors (i.e., religion), and ancestry1 predicted refugees’ cognitive ability scores. The extent to which these associations suggest a causal role is not unproblematic, e.g., education has an effect on intelligence, but also vice versa, it is the same or even more so with wealth, which could lead to an overestimation of “effects” on migrant IQ for both. The measurement is also suboptimal (for all and especially for genetic ancestry and culture), which could lead to an overall underestimation of their possible effects. What the causal effect of country-of-origin IQ on migrant IQ might be also remains open: The individual IQ of a migrant may partly reflect the general ability level of their country of origin. However, the cognitive development of a person can also be influenced by the ability level of society in that country—through parents, kindergarten teachers, schoolteachers, neighbors, friends, doctors, journalists, clergy, scientists and others—as well as by the overall quality of the environment they create.
The study therefore contained a main message (IQ level) and a secondary message (validity and causes within the migrant sample). None of these results were particularly new or surprising. The low level of ability is confirmed by numerous other studies in countries of origin or in student achievement and intelligence test studies in Europe with migrant samples (see studies of other authors and research institutions mentioned in Rindermann et al., 2024). The only new and surprising finding was the clearly visible increase in the level of ability of migrants compared to studies in their home countries.
This makes it all the more surprising how demanding the publication process was. As described by the editors McMahan et al. (2024), the review process took three years (“unusually long time”; p. 2). There were four rounds of reviews with three reviewers in the first round, the same three reviewers from round 1 plus two new reviewers in round 2, and two further rounds of methodological reviews by two different reviewers. And this, to repeat, despite the study being quite simple (from another opinion: “The study itself is pretty basic.”; Kirkegaard, 2024) and not coming to results that differ from previous studies (for Germany former PISA-, IQB- and psychometric intelligence test studies; e.g., Stanat et al., 2019, around IQ 80 to 82 for students with parents from Arab countries2).
2. Topics of Comments and Criticism and an Outline of this Response
Three invited commentators criticized methodological aspects of the analyses of possible causes (Turkheimer & Harden, 2024) or questioned ethical implications of lower intelligence of immigrants (Hillier-Smith, 2024; Wellman, 2024). The main message of the paper (the cognitive level of refugees is above that of the countries of origin but below that of a European country) was not questioned. The critical points and suggestions are presented in detail and answered in the following sections.
3. Disciplinary (Empirical-Methodological) Aspects of the Study
3.1. Content-Related Scientific Points of Criticism by Turkheimer and Harden (Test-Diagnostic, Empirical, Statistical Questions)
The following points were critically raised by Turkheimer and Harden (2024) and the relevant page number from their article given. My responses follow directly after each criticism.
(1) Using a map from Biasutti (1967, p. 224, “distribuzione della varia intensita del colore della pelle” [distribution of various intensities of skin color]) taking skin lightness as an indicator for ancestry; transfer of hatching on a map into numbers for countries by a student (p. 2).
The answer is already in the manuscript, and can be found in the article’s supplementary materials (Rindermann et al., 2024, Appendix, p. 5):
Correlations based on noncolonized regions with data from Jablonski and Chaplin (2000, p. 74f., [their Table 6, “Observed reflectance at 685 nm”]) and Templer and Arikawa (2006, p. 124f. [their Table 2, “Skin color”, darkness reversed to lightness], also based on Biasutti) are r = .92 (N = 48 [countries]) and r = .98 (N = 129). ... This factor does not represent direct genetic effects on psychological traits, i.e., causality between genes, neurological structures, attitudes, and behavioral patterns. Rather, it stands for the possible effects of evolution [now: ancestry], which could be determined in the future by detailed genetic-psychological studies. Each of the two indicators has its advantages and disadvantages. Although light-skinnedness is certainly not a causal variable, it has the advantage of being largely exogenous to economic, social, and cultural factors. In contrast, cranial capacity appears to have a causal effect on intelligence (Gignac & Bates, 2017; Lee et al., 2019) and it is also an indicator of ancestry (Ousley et al., 2009, [pp. 72ff.]), but has the disadvantage of being somewhat endogenous to wealth, i.e. not being completely independent of wealth (Lynn, 1990). Measurement deficits (e.g., results from brain imaging studies of cranial volume would be better data) are more likely to lead to underestimation of correlations with these indicators of evolutionary origin. In the future, information from intelligence-coding genes should be used, but so far these are not available worldwide ...”
There are two points of criticism:
- Transfer of the values from a map into country data by a student. However, the correlations of r = .92 (based on other sources) and r = .98 (based on the same source Biasutti) with publications by other authors on these data, already mentioned in the article, show that the transmission was accurate. Incidentally, the other two publications used tables with values per country, so our transfer from a map was no problem: r = .98 is an almost perfect correlation! Finally, this supports the reliability of the procedure: “Two independent sources were combined: Jablonski and Biasutti (Cronbach-α = .96; N = 193)” (Rindermann et al., 2024, Appendix, p. 5). The reliability is extremely high. Turkheimer and Harden’s commentary implies they either did not read this information in the appendix, or they ignored it.
- Understanding skin lightness as an ancestry marker. As already described, skin lightness and brain size each have their strengths and weaknesses when used as markers of ancestry. For example, for Shriver et al. (2003) skin pigmentation is a phenotypic marker that provides information about ancestry (correlations with “estimates of individual ancestry” around r = .43; p. 387). Its advantages are:First, the large differences observed in pigmentation between continents make admixed populations particularly useful for mapping the genes involved. Second, constitutive pigmentation (pigmentation as measured in unexposed areas) is largely independent of environmental influences. (Shriver et al., 2003, p. 395)
Of course, controlling for societal-cultural factors is advisable in statistical analyses. For an alternative measure of ancestry, see the next point.
(2) Using a map from Beals et al. (1984, p. 304, “Brain size, cranial morphology ...”) as source for world-wide distribution of brain size (“cranial capacity”); transfer of hatching on a map into numbers for countries by a student (p. 2).
There are two points of criticism:
- Transfer of the values from a map into country data by a student. As indicated above, the method of transferring data from a map to countries has proven to be reliable, as can be seen from the high correlations (for the skin lightness measures: r = .92 and r = .98).
- Use of inappropriate indicators for ancestry. Better would be, for example: “measuring participants’ global brain volume using fMRI (functional magnetic resonance imaging), as is standard in neuroscience” (Turkheimer & Harden, 2024, p. 2). We agree (as indicated by the text quoted in the response to the first criticism above, we wrote in the article: “results from brain imaging studies of cranial volume would be better data”), that this is of course a better variable—also individual brain size measured via fMRI.3 But apart from the effort and cost, it is completely impossible to do something like this for political reasons in the current climate.
But there are also other useful indicators of ancestry developed by colleagues: Genetic distance from the cradle of Homo sapiens in South Africa or Ethiopia. Cavalli-Sforza et al. (1994, pp. 75–76) calculated FST genetic distances between 42 populations. Spolaore and Wacziarg (2009, pp. 480–487) used these data to calculate the genetic distances between countries at the country level and their current populations. FST distance is first and foremost a measure of the genealogical relationship between populations; if one takes South Africa as the “cradle of humanity” as a starting point (León & Burga-León, 2015), then it represents an indicator of ancestry as evolutionary history.4
Upon closer examination, the data revealed some implausible results: the four countries that were genetically most similar to South Africa were Algeria, Libya, Morocco and Tunisia; only then came Niger and other countries south of the Sahara. The population of the four North African countries’ neighbor, Egypt, is genetically much more distant from the South African population (which is plausible) than that of these four countries. I wrote to Romain Wacziarg, who pointed to a more recent and better data set on genetic distances (Spolaore & Wacziarg, 2018). These data are based on human microsatellite variation from Pemberton et al. (2013) covering 267 worldwide populations. Again, Spolaore and Wacziarg calculated the genetic distances between countries at the country level and their current populations.5 I used these data to take the genetic distance from Ethiopia (also the cradle of humanity).6
In an international sample, the correlations between genetic distance to South Africa and Ethiopia and the g-factor ancestry used in the article (Rindermann et al., 2024) were r = .69 and .40 (N = 174 and 159 countries, respectively; the two genetic distance measures correlated r = .67, N = 172). In the 15-country sample with at least five BOMAT IQ (a culture reduced figural test of reasoning) observations per country, the correlations with the g-factor ancestry were r = .72 and .93 (N = 15 countries). If we replace the g-factor ancestry with the genetic distance measures for Table 5 of the article, the correlation with individual BOMAT-IQ changes from r = .29 (N = 497) to r = .22/.28 (N = 499/497). When controlling for geographical distances between countries, the effects of genetic distances remain (β = .16/.44, South Africa/Ethiopia) and are considerably larger than the geographical ones (β = .08/−.22; N = 499/497). For Table S1 (Correlations at the country level; Rindermann et al., 2024) the correlation with country BOMAT-IQ changes from r = .67 (N = 15) to r = .57/.77 (N = 15). Similarly, when controlling for geographical distances between countries, the effects of genetic distances remain (β = .32/.84, South Africa/Ethiopia), but they are not always larger than the geographical ones (β = .40/−.08; N = 15).
Compared to the g-factor ancestry the correlations are slightly smaller or higher. In principle, the relationship between ancestry factors is confirmed. To use this variable in a path model, see below. Of course, genetic effects must always be controlled for possible environmental factors (e.g., see above, geographical distances). But even when these are controlled, genetic effects (on intelligence) remain (see the studies from Becker and Rindermann (2016), Kodila-Tedika and Asongu (2016) or Rindermann et al. (2012)).
Again: All the data used here are suboptimal. The exact sources for skin lightness and cranial capacity are unclear, and there is obviously some implausible data on genetic distances. Data for individuals would be better still. However, all this is likely to lead to an underestimation of possible genetic effects. Finally, the use of genes that encode intelligence and causally influence it (via neurological processes and structures) would be optimal. Everything else provides only indirect, tentative evidence.
Another relevant genetic effect (not mentioned in our study) is exogamy vs. marriages between relatives (consanguinity). Consanguineous marriages have harmful health effects, including neurological and psychological implications. (The fate of the Spanish branch of the Habsburgs is notorious.) Exogamy also entails—from today’s perspective—positively valued social, political and cultural developments such as rights to individual self-development and democracy (Henrich, 2020; Schulz, 2022; Woodley & Bell, 2013). Presumably this tradition or its rejection goes back to cultural factors, Christianity plays an important role (e.g., Henrich, 2020; Rindermann, 2018, pp. 313–316), but exogamy is even older in Europe (e.g., MacDonald, 2019). In contrast, consanguineous marriages are common in Arab, Muslim and African countries. Using country level data from Woodley (2009) and Tadmouri et al. (2009) the correlation of consanguinity with individual Bomat-IQs is r = −.09 (N = 331) and at the country level r = −.17 (N = 9). The correlations are not high but negative as assumed. Data are missing for several countries, and individual data for each migrant would certainly be better.
(3) Using a factor analysis with two variables (“One of the most basic rules of factor analysis is that any factor solution requires at least three indicators.)” (p. 2).7
Turkheimer and Harden (2024; Turkheimer, 2024) assert firmly that factor analysis requires at least three variables. They do not provide any reasons or references for their assertion and, furthermore, their claim is not correct: In a factor analysis with two variables the loadings of the variables must both be fixed to 1 (assuming essential tau equivalence). The model is then saturated (df = 0; “just identified”; e.g., Geiser, 2023). The “holy book” of statistical methodology by Jacob Cohen and colleagues (Cohen et al., 2003, p. 473, Figure 12.5.2) gives an example of this (a latent variable with exactly two indicators), as does the more recent Backhaus et al. (2023, p. 417, their Figure 7.4). However, we have used here a principal component analysis for extraction. This also works without such restrictions with two variables. Nevertheless, the scientific gain compared to a simple item averaging (after z-standardization) for a scale is zero—the g-factor and the mean of such an item averaging correlate at r = 1.8 This also proves that the g-factor construction via the first unrotated factor is correct, but unnecessarily complicated.9
(4) In parentheses of the path analyses shown, correlations are given rather than standard errors (p. 3).
We explained this in the published paper (Rindermann et al., 2024, p. 16):
In these [path] analyses, the standardized path coefficients (β) between different variables are most important. Correlations are always added in parentheses. The differences between correlations and path coefficients help to quickly estimate the influence of other variables in a model (the larger the difference, the larger the statistical influence of other variables), and they enable model checking (∑rβ = R2 = 1—residual; the sum of the products of the correlations and beta coefficients gives the variance explained; residual/error is the unexplained variance) and calculation of the proportion of variance explained by each single predictor (R2 = rβ).”
Standard errors were reported in the publication in Tables 2 and S2 (Rindermann et al., 2024).
(5) Standard errors are not interpreted, no use of significance tests (p. 3).
Standard errors as well as significance tests are both part of the idea of inferential statistics, which is generally not very useful, especially at country level (Pollet, 2013). As written in the original manuscript, here extended by two more references and the publication titles:
Significance tests were not used for interpretation (for a detailed rationale, see, e.g., Cohen (1994), “The earth is round (p < .05)”; Falk and Greenbaum (1995), “Significance tests die hard. The amazing persistence of a probabilistic misconception”; Gigerenzer (2004), “Mindless statistics”; Hunter (1997), “Needed: A ban on the significance test”; Wasserstein et al. (2019), “Moving to a world beyond ‘p < .05’”). More instructive for inductive generalization—which is not possible with significance tests—is the demonstration of the stability of relationships and effects across different country samples, different variables, different measurement points and various studies by different authors using different methods. (An attempt in this direction was already the analysis with three different data levels in the study—individual, multilevel, country average; Rindermann et al., 2024, Figures 2, 3, S2.)
The larger a standard error (or “standard uncertainty”), the less one can trust the exact value of a path coefficient (beta), the larger the range around the given value in which the true value can lie (beta coefficient minus and plus standard error). If this range includes 0, the true effect could also be zero (meaning no effect).
(6) Warning messages in the Mplus output indicate that standard errors may not be trustworthy (p. 3).
There were warning messages for the path model depicted in Figure 3 (Multilevel path analysis at the individual and country level …; Rindermann et al., 2024): “The model estimation has reached a saddle point or a point where the observed and the expected information matrices do not match. ... The standard errors of the model parameter estimates may not be trustworthy for some parameters ... The nonidentification is most likely due to having more parameters than the number of clusters. Reduce the number of parameters.” However, when considering the standard errors (Table S3 of the article’s appendix; Rindermann et al., 2024), no conspicuous values were found. Nevertheless, the effect of GDP was unusually high (βGDP = .70). The implications of these warnings are difficult to assess. This requires comparative analyses with different variables and numbers of variables, which we do below. In addition, there are correlational results and traditional regression analyses that confirm the findings.
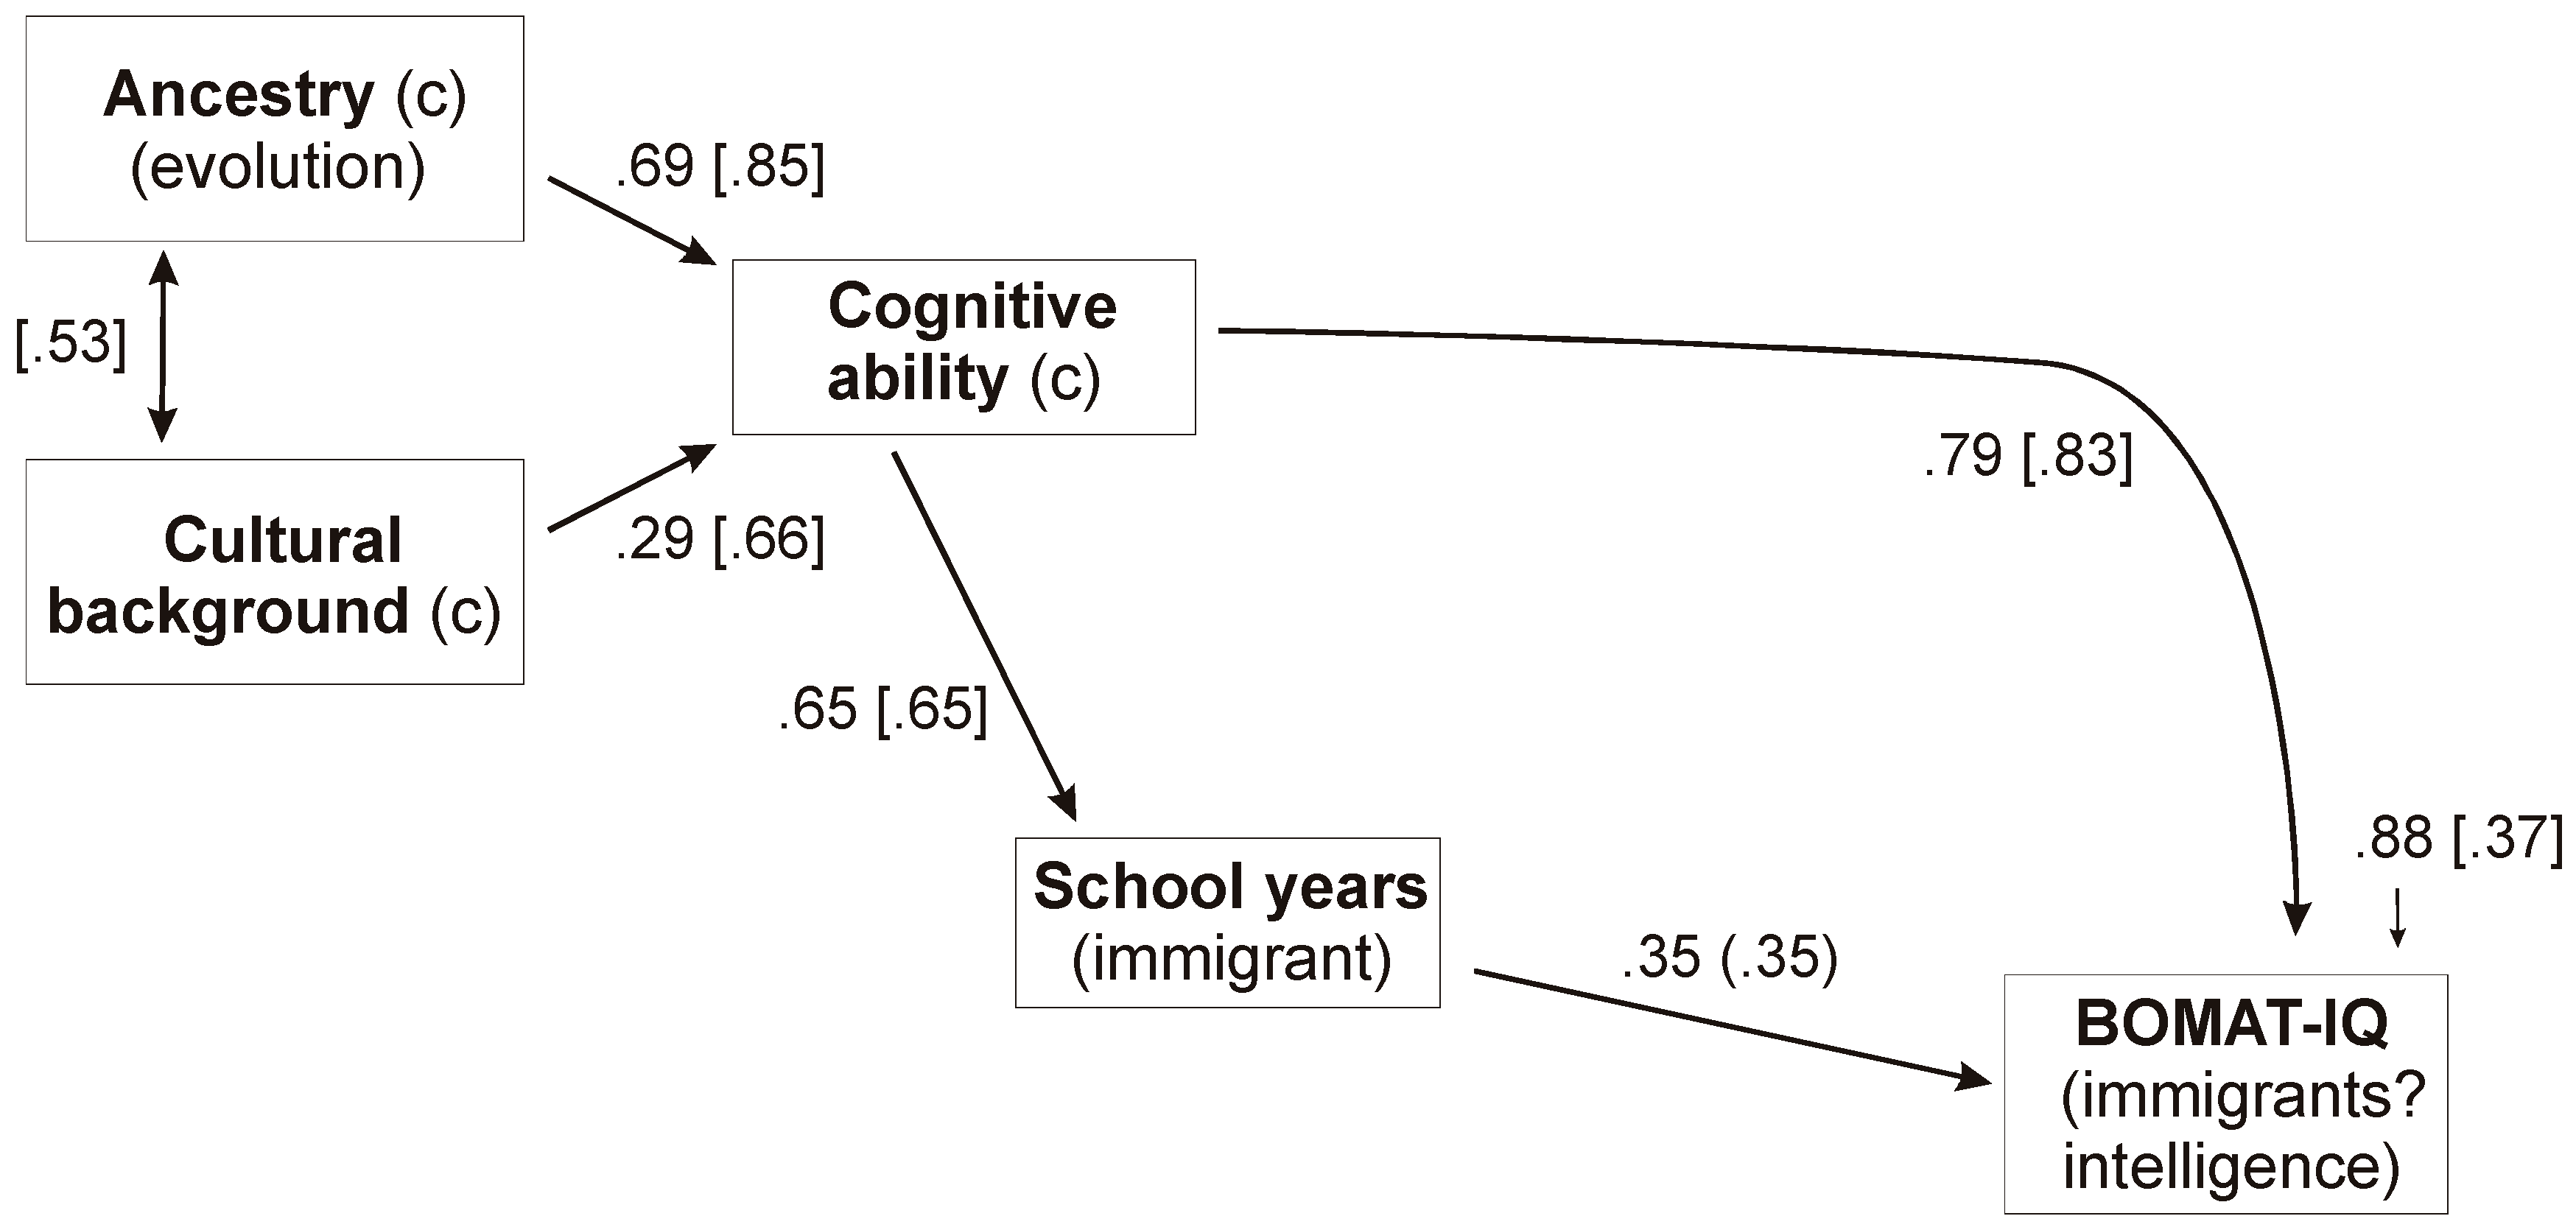
As quoted, Mplus recommended a reduction of the parameters. We removed the variable with an effect outside the usual range of values (GDP). Now the Mplus warnings disappeared. The effects remained the same except for the increase in the direct impact of the country cognitive ability level (from βCA = .36 to βCA = .79; see Figure 1 here). Although the model is now without warnings, it could be “misspecified”, i.e., a potentially important variable or determinant (here: wealth) is missing. To have both (models without warnings and with GDP) we would need larger country samples (more than 15 countries as given here).
Figure 1.
Multilevel path analysis at the individual and country level (c) with country of origin (ancestry, culture, cognitive ability) and individual (school years, BOMAT-IQ) variables, criterion immigrants’ intelligence (BOMAT-IQ); same as in Figure 3 of Rindermann et al. (2024), but without productivity-income (GDP/c); standardized path coefficients, individual-level correlations in parentheses, country-level correlations in brackets, FIML, error term as unexplained variance (individual .88, country .37), CFI = .996, SRMR = .006 within [.064 between]), standard errors in Table 1, N = 425 persons and 15 countries].
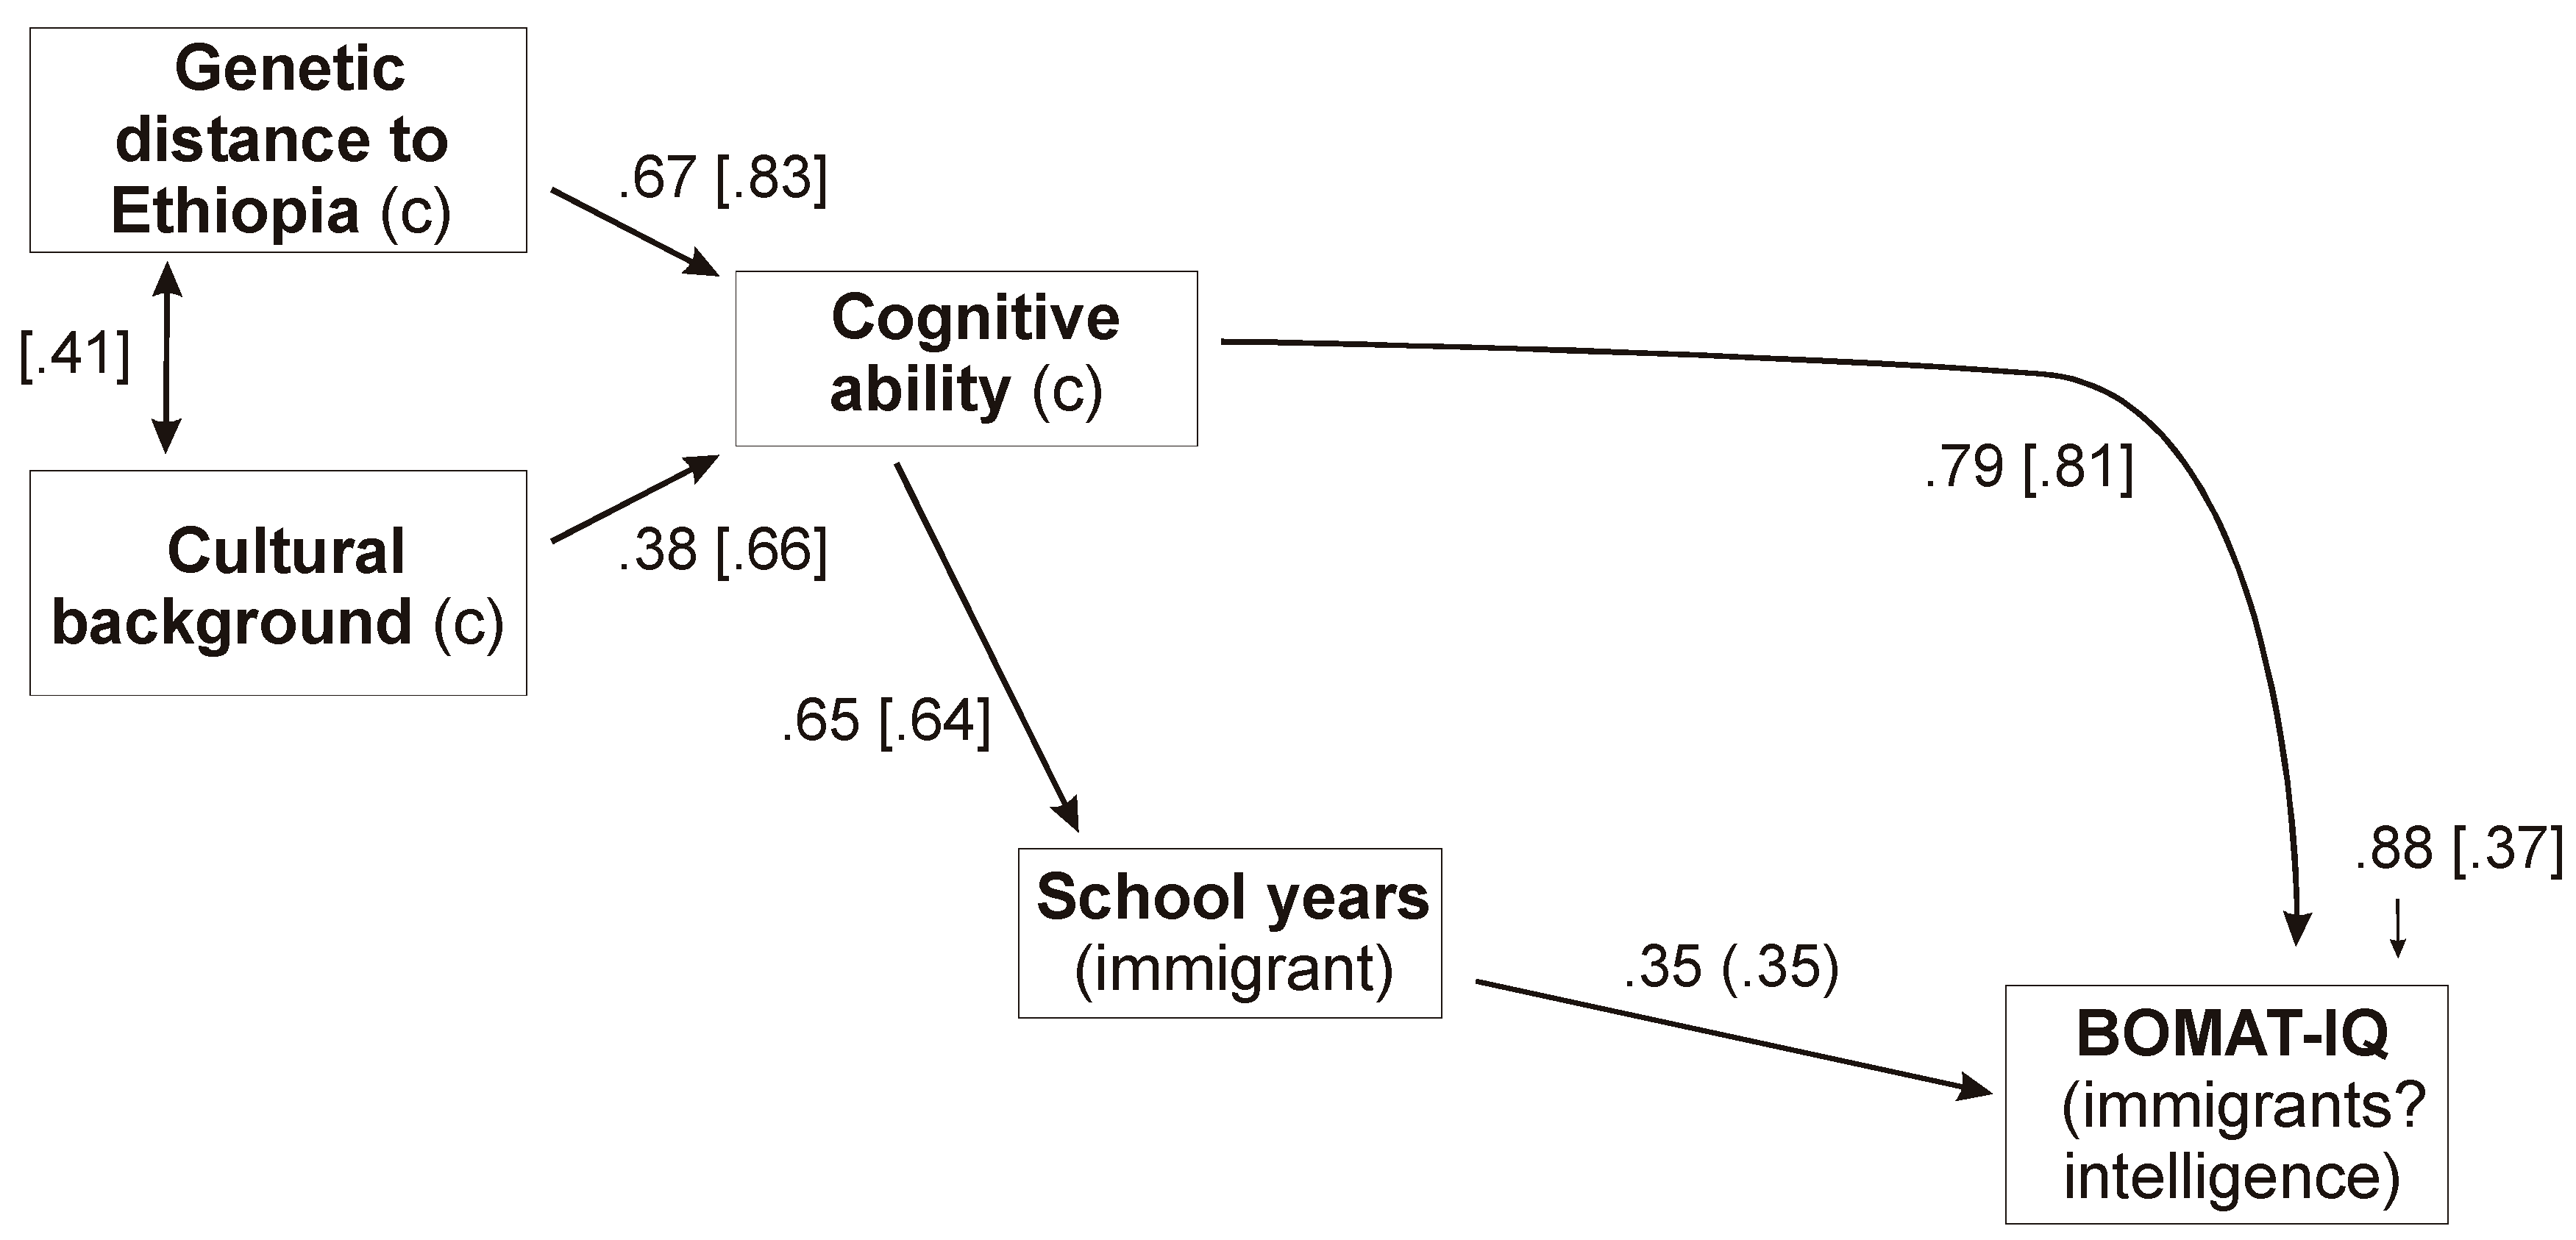
But there has also been criticism of the ancestry factor (see above). If we replace this with genetic distance from the cradle of humanity (Ethiopia; see above), the effects change only minimally. Behind cognitive ability were ancestry (βAnc = .69, now βDenD = .67) and culture (βCul = .29, now βCul = .38; see Figure 2 here).10
Figure 2.
Multilevel path analysis at the individual and country level (c) with country of origin (genetic distance to Ethiopia as the cradle of humankind, culture, cognitive ability) and individual (school years, BOMAT-IQ) variables, criterion immigrants’ intelligence (BOMAT-IQ); same as in Figure 3 of Rindermann et al. (2024), but without productivity-income and instead of an ancestry factor here with genetic distances; standardized path coefficients, individual-level correlations in parentheses, country-level correlations in brackets, FIML, error term as unexplained variance (individual .88, country .37), CFI = .948, SRMR = .001 within [.090 between]), standard errors in Table 1, N = 425 persons and 15 countries.
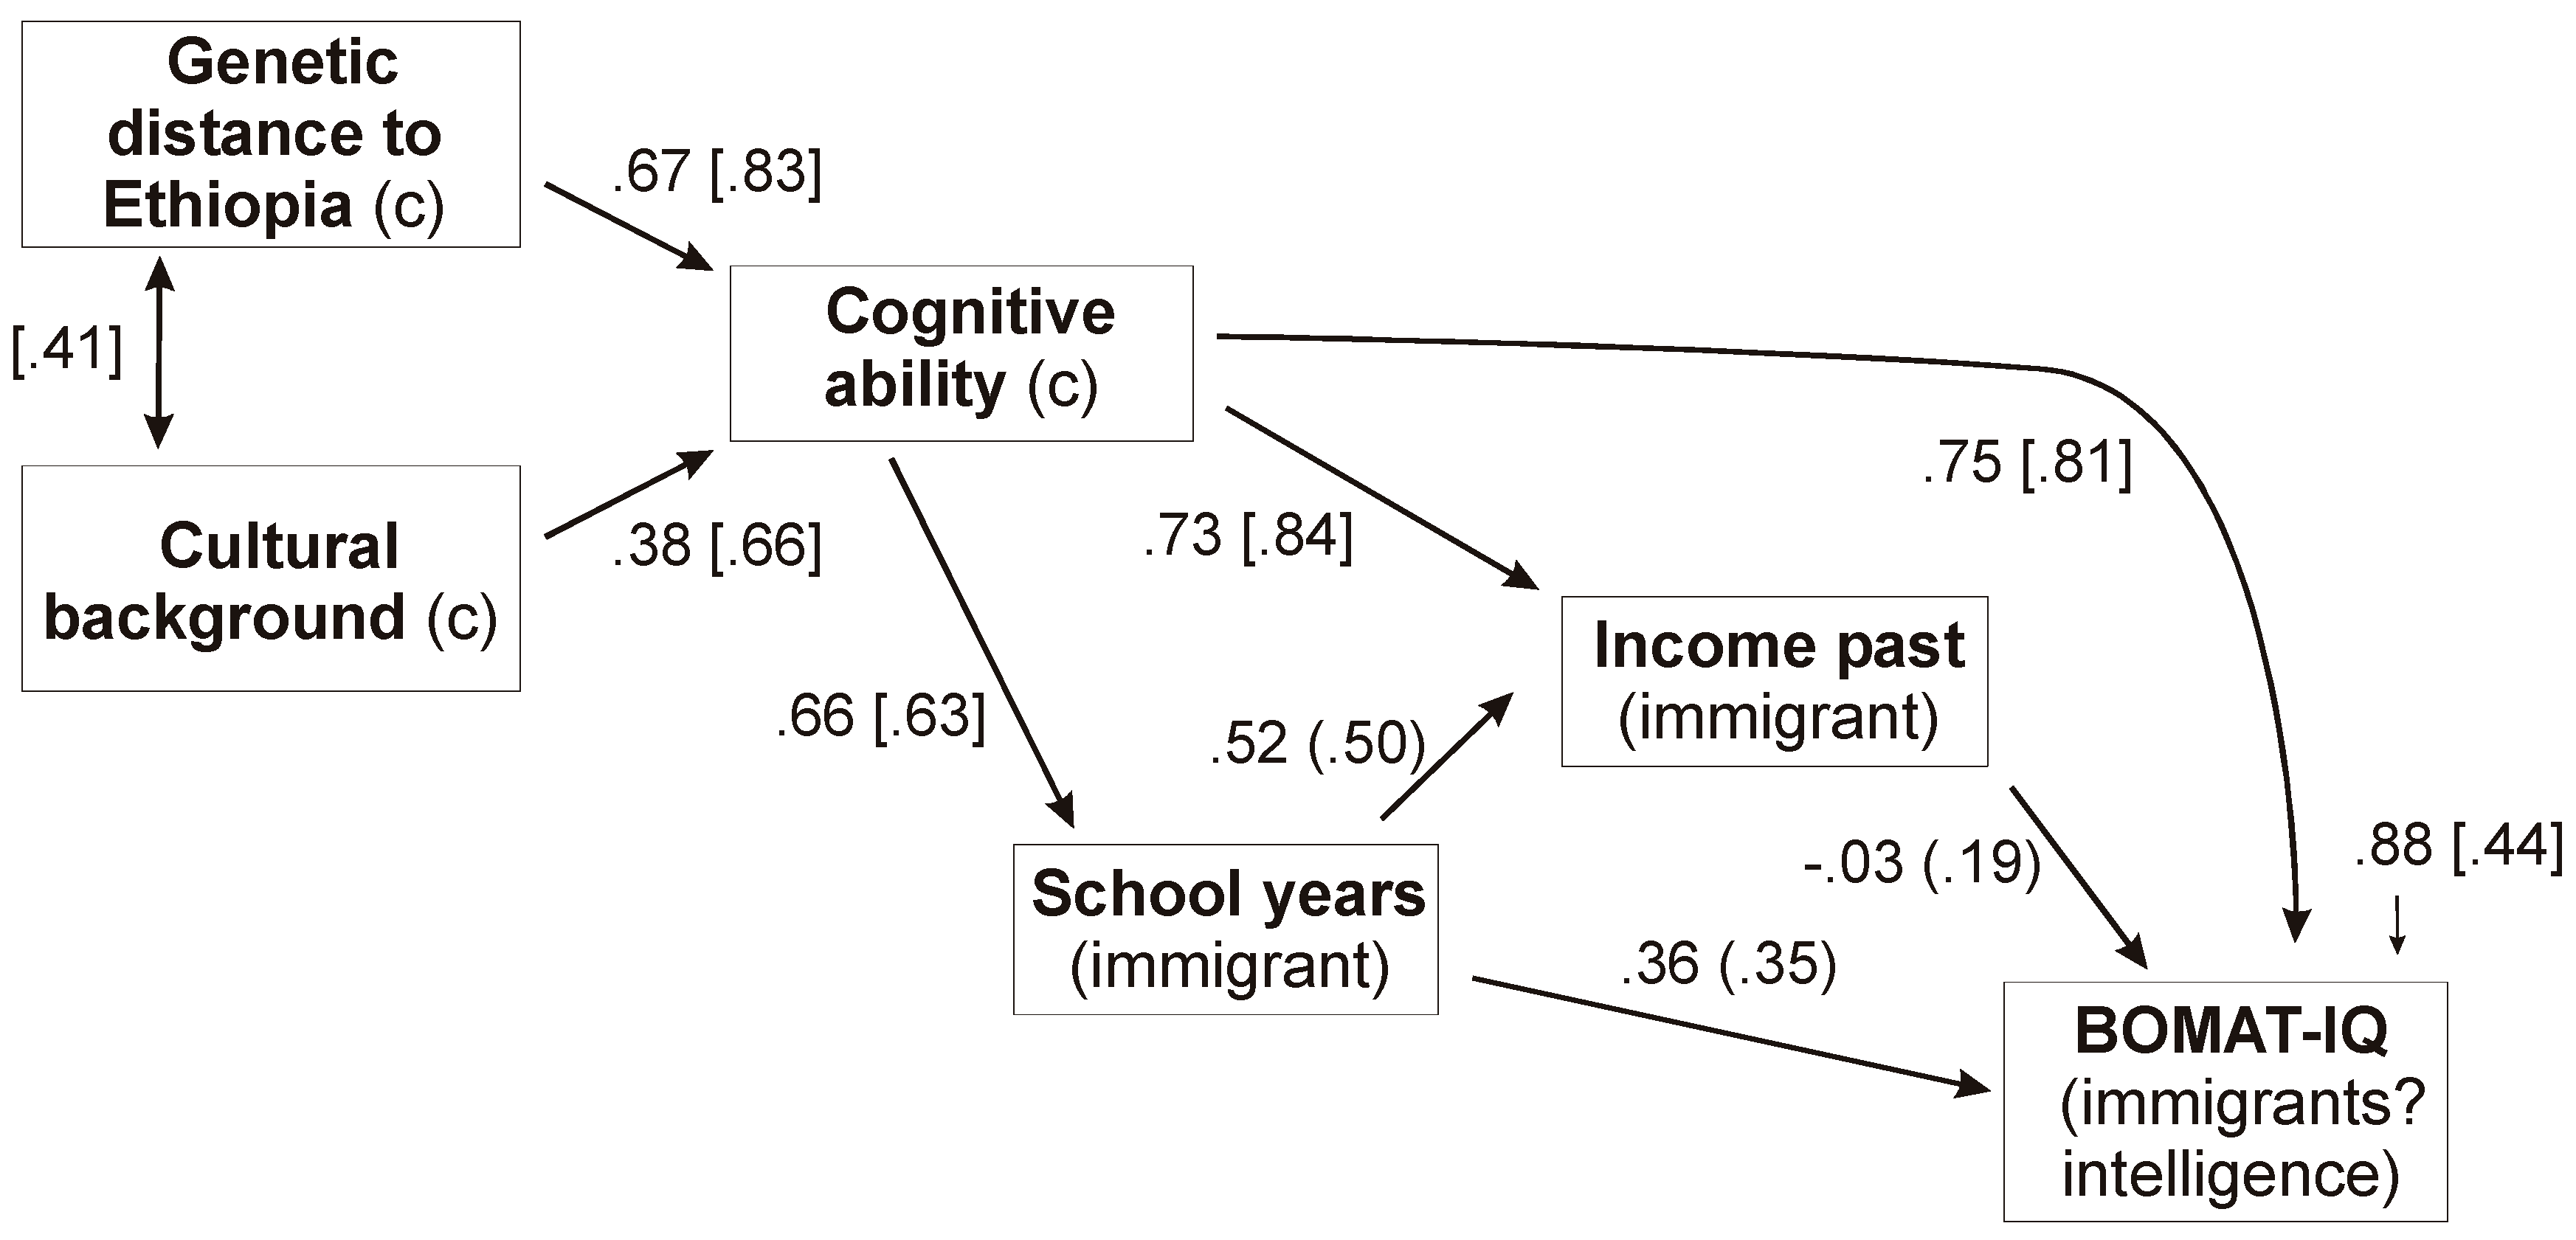
We have now tried to take into account the individual income in the country of origin instead of the level of societal wealth (logarithm of average GDP per capita). However, the warning messages appeared again, the same as for Figure 3 of the article (Rindermann et al., 2024; from the Mplus output: “Observed and the expected information matrices do not match. ... Reduce the number of parameters.”). In addition, there was now a standard error outside the defined range of values (see Table 1; SE = 1.34 for the effect income → BOMAT-IQ). If it is above 1 for standardized effects, it is undefined (only suppressor effects may make sense). The results should therefore be interpreted with caution.
Plausibly, individual income depends on one’s own education (βSchool = .52; see Figure 3 here) and country cognitive ability level (βCA = .73; GDP/c would also have to be included here). The effect of income on individual intelligence is considerably smaller (βInc = −.03) than that of education (βSchool = .36), which is consistent with similar findings regarding parental education and parental income effects on the IQ of their children (Rindermann & Ceci, 2018). Due to the warnings, in a further multilevel model we only used the three individual variables, but the pattern of results is repeated: Education (βSchool = .39) is more important for intelligence than income (βInc = .08). Education has a positive impact on income (βSchool = .34).11 However, due to the small number of countries (and the warnings for Figure 3), the findings should be interpreted with caution and require replication in larger samples.
And the following limitation applies to all models here: Reciprocal effects between intelligence and education as well as intelligence and income were not taken into account. This means that the models provide only a partial representation of reality.
Figure 3.
Multilevel path analysis at the individual and country level (c) with country of origin (genetic distance to Ethiopia as the cradle of humankind, culture, cognitive ability) and individual (school years, BOMAT-IQ) variables, criterion immigrants’ intelligence (BOMAT-IQ); same as in Figure 2 here, but with individual income (in the country of origin); standardized path coefficients, individual-level correlations in parentheses, country-level correlations in brackets, FIML, error term as unexplained variance (individual .88, country .44), CFI = .953, SRMR = .015 within [.159 between]), with warnings (“observed and the expected information matrices do not match ... The nonidentification is most likely due to having more parameters than the number of clusters. Reduce the number of parameters.”) standard errors in Table 1, N = 425 persons and 15 countries.

| Path | Standardized Beta | Standard Error |
|---|---|---|
| Figure 1 | ||
| ancestry (c) → cognitive ability (c) | .69 | .12 |
| culture (c) → cognitive ability (c) | .29 | .15 |
| cognitive ability (c) → school years | .65 | .18 |
| cognitive ability (c) → BOMAT-IQ | .79 | .13 |
| school years → BOMAT-IQ | .35 | .04 |
| Figure 2 | ||
| genetic d. (c) → cognitive ability (c) | .67 | .12 |
| culture (c) → cognitive ability (c) | .38 | .13 |
| cognitive ability (c) → school years | .65 | .18 |
| cognitive ability (c) → BOMAT-IQ | .79 | .13 |
| school years → BOMAT-IQ | .35 | .04 |
| Figure 3 (with warnings) | ||
| ancestry (c) → cognitive ability (c) | .67 | .12 |
| culture (c) → cognitive ability (c) | .38 | .14 |
| cognitive ability (c) → school years | .66 | .23 |
| cognitive ability (c) → income | .73 | .23 |
| school years → income (in the past) | .52 | .29 |
| cognitive ability (c) → BOMAT-IQ | .75 | .16 |
| school years → BOMAT-IQ | .36 | .13 |
| income → BOMAT-IQ | −.03 | 1.34 * |
Notes: (c) stands for a country-level variable. * value outside the defined range.
(7) Poverty, political strife, war (p. 3).
Turkheimer and Harden (2024, p. 3) suggested that poverty, political conflict and war, in short, experienced stressors, are responsible for the weak test results (relative to the First World). “Some refugee immigrants, fleeing from countries beset by poverty and political strife, now torn apart by unrelenting war, obtain upon arrival in Germany lower scores on IQ tests than the resident German population.”12 This is a plausible hypothesis. According to DeGroot (1951), intelligence in the Netherlands fell during the Second World War and the Nazi occupation from an IQ of 101.5 to 97.7, i.e., by around −4 IQ. We have already dealt with this aspect in the study. Based on the data, it is probably not the case that such experiences are decisive for this result. As we discussed in the article, the IQ results of refugees are better than the those found in their country of origin (usually collected before armed conflicts):
Another important finding is that the average intelligence level of immigrants in Germany is about 5 to 10 IQ points higher than the averages in their countries of origin (Table 3). This means, first of all, that an explanation of trauma or negative selection for the gap between natives and immigrants is not convincing. Refugees are significantly more intelligent than the average student and young adult in their home countries. It is rather implausible to assume that there are geniuses who immigrate to Germany and later suffer traumas that cause an IQ of 88. (Rindermann et al., 2024, pp. 27–28)
Another study on people who had experienced most extreme stress (Holocaust survivors; meta-analysis by Barel et al., 2010) pointed to stress (posttraumatic stress symptoms, d = .72; their Table 6), but cognitive effects were low (cognitive functioning including intelligence, d = .10; their Table 8). Yes, the assumption of stress-reduced intelligence is plausible, but if empirical studies do not confirm this, then this thesis can no longer be defended. (For the effect of political conditions, see point 9 and Section 4.2.1. here)
Finally, it is not just that “some refugee immigrants” score poorly on cognitive tests, but this is the average of four studies (see another below).
(8) Study results are not sufficiently controversial. No legitimate controversy (p. 4).
Turkheimer and Harden (2024, p. 4) question on the one hand whether the refugee IQ study is sufficiently controversial (“Is this controversial?”), but on the other hand they do not rate the study as a “legitimate controversy”. So the entire paper is somehow wrong for the Journal of Controversial Ideas. Strange. It seems that, from their point of view, no such study should be published at all.
(9) Cognitive ability treated as an “essential feature baked into immigrants, an ultimate cause of the chaos in their home countries and fraught migration to new homes in Europe. The skills tested by a matrix reasoning task, we are told, are the ultimate cause of wealth and democracy, rather than their result. There is, however, no evidence this is the case” (p. 4).
What do Turkheimer and Harden mean by an “essential feature”? If they mean an unchangeable feature, then this is not our position. Our own studies (and those of other authors) have also shown the changeability of intelligence and student achievement in countries at different stages of development (for Turkey: Rindermann et al., 2013; USA: Rindermann & Thompson, 2013; worldwide: Rindermann & Becker, 2023). We also do not assume one-sided effects of intelligence. Many of my studies in particular have analyzed interactions between intelligence and society. For example, between cognitive human capital (IQ), economic freedom and wealth (income): Wealth is more relevant for the cognitive development of poorer countries and cognitive ability is more relevant for the wealth development of richer countries (Rindermann, 2018, pp. 225–233). The same holds for political conditions (“positive politics” which includes the rule of law, political freedom and democracy): While cognitive ability showed in cross-lagged panel studies a strong positive impact on politics, the effect of politics on cognitive ability was zero or close to zero (Rindermann, 2018, pp. 244–248).
Overall, however, many research results and, in particular, statements by scientists in this field remain contradictory. For example, there are well-known scientists who claim that education has no effect on cognitive competence. Education is claimed to be only an indicator of ability (Spence, 1973; Charlton, 2009; G. Miller, 2009; Murray, 2008; Caplan, 2018). As an actor and recipient of research, one should in the end take a step back, intellectually allow a variety of methods, consider the work of different authors from different disciplines and paradigms and come to a balanced judgment.
3.2. Aspects of Style and Tone
The style and tone of Turkheimer and Harden’s commentary are unusual for a scientific article. Quotes from the text:
- –
- “Controversy requires competence” (p. 1)
- –
- “pseudoscientific approach” (p. 1)
- –
- “highest levels of scientific rigor and editorial discretion ... are absent here” (p. 1)
- –
- “We are surprised, to put it mildly, that peer reviewers approved this meaningless analysis and the resulting factor label for publication in a professional scientific journal.” (p. 2)
- –
- “The statistical blundering continues.” (p. 3)
- –
- “The authors seem not to understand the role of sampling error in the interpretation of statistical estimates.” (p. 3)
- –
- “they give themselves permission to ignore traditional standards of statistical significance” (p. 3)
- –
- “casual comparisons they indulge in throughout the text” (p. 3)
- –
- “these pseudo-analyses” (p. 3)
- –
- “Would you expect the paper to be accepted at any legitimate scientific journal?” (p. 3)
- –
- “when the authors deign to treat their research participants as individuals” (p. 3f.)
- –
- “IQ scores have always provided a convenient essentialist proxy for racist anti-immigrant sentiment.” (p. 4)
- –
- “The authors do not have a scintilla of data supporting their contention that the test scores of immigrants have anything whatsoever to do with their ‘evolution.’” (p. 4)
- –
- Further attacks on the journal and its editors, e.g., “calling a collection of papers posted online an “academic journal” and “If the paper is representative of the discernment of some of the world’s most eminent philosophers and scientists, we fear for the future of academic publishing.” (p. 4f.)
And in a commentary published by Turkheimer (2024) alone on Substack:
- –
- “We couldn’t believe what we saw. Yes, it was openly racist, ridiculously essentialist about IQ, and filled with clumsy political argumentation.”
- –
- “Well below grad student level.”
- –
- “But someone ‘competent in statistics’ thought a factor analysis of two observed variables was OK? On the off chance that anonymous statistician reads this, would you consider defending your opinion? I just can’t imagine.”
- –
- “But in normal peer review, competence in statistics plays another role, that of certifying some minimal level of expertise. If I am peer reviewing a paper that makes a blatant statistical error on the second page, it’s game over. I don’t think, oh would they maybe have gotten similar results if they had done this correctly? I think, get back to me when you know what the f*** you are doing. I’m a busy person.”
- –
- “They [The authors] use statistics to dress up their anti-immigrant racism in something that has the superficial appearance of science. That’s a definition of pseudoscience.”
The style of these comments could signal that something is wrong here. Scientists engage in argumentative discussions with others. In such discussions, excessive emotion is not helpful. Credible and reasonable thinkers qualify their claims, consider and appreciate reasons that point in a different direction, and tend to take the viewpoints of others seriously.
Turkheimer is a co-author of a recently published article (Matthews et al., 2024) that accused other scientists of conducting “abhorrent science” and suggested excluding such studies from the publication process. In an earlier article, Turkheimer appealed to a supposed ethical principle (which reflected political–ideological criteria) to determine which empirical claims should be accepted:
“We can recognize a contention that Chinese people are genetically predisposed to be better table tennis players than Africans as silly, and the contention that they are smarter than Africans as ugly, because it is a matter of ethical principle that individual and cultural accomplishment is not tied to the genes in the same way as the appearance of our hair.” (Turkheimer, 2007)
Bernard Davis (1978) coined the term “the moralistic fallacy” for answering scientific questions through moral-political values. Ultimately, the pretense here is to think morally, but this actually serves ideological power politics: fighting those who think differently and excluding their views from publication. The contributions by Turkheimer and colleagues make it clear that we need an ethics of behavior among scientists, an ethics of argumentative debate and an ethics of dealing with others in general (e.g., Rindermann, 2006). Empirically, contributions could be evaluated by independent raters with respect to their potential for hate or incitement, and these evaluations could be examined in relation to the empirical and innovative content of the contributions.
4. Ethical and Political Aspects
4.1. Possible Effects of Intelligence of Refugees
Two philosophers have critically noted that the intelligence of refugees is not a relevant criterion for determining whether there is an ethical obligation to help them. Even so, Christopher Heath Wellman (2024) discusses whether relatively low intelligence does not lead to greater burdens on the part of the host country as well as the immigrants and whether it is therefore advisable to help people in their home countries and regions rather than supporting them in their resettlement. Another aspect is that when the relatively more intelligent people of a country emigrate, development in the country of origin is impaired. African countries, but also Venezuela, are suffering from brain drain (Kapur & McHale, 2005).13 Some have proposed a kind of tax to be paid by the emigrating skilled workers who benefit from brain drain (“Bhagwati tax”; e.g., Oldman & Pomp, 1975). But the idea is already around 50 years old and still not realized and probably never will be, not even in the form that countries that benefit from the brain gain would pay for it (e.g., Switzerland; Ben-Hur et al., 2017). However, the advantages of emigration of cognitive elites (“intellectual classes”; Coyle et al., 2016) are also pointed out: if they work in wealthy countries, they send money to those who stayed at home, which generates more income and wealth than development aid. In addition, this motivates people in the relatively poorer emigration countries to invest in education. For example, in Pakistan, Naipaul (1981) described a mother and member of a religious minority (followers of the Ahmadiyya doctrine, which is related to Islam) who was particularly concerned that her children learn English so that they could go abroad. The possibility of emigration also influences politics in the home country, reducing the likelihood of competent citizens being too badly treated.14
4.2. Are Characteristics of Migrants Relevant and Legitimate Criteria for Decisions of Potential Host Countries?
Bradley Hillier-Smith (2024) argues that the obligation to support refugees does not depend on their cognitive characteristics (pp. 6–8) and the costs involved (pp. 3–6, 14–16).15
4.2.1. Significance of the Test Results and Possible Causes
First, Hillier-Smith (2024, pp. 2–3) looked at the intelligence test results and questioned their meaningfulness. However, there is a large number of studies on the cognitive abilities of migrants, intelligence test studies, but even more so the many large student achievement studies (PISA, TIMSS, PIRLS [Programme for International Student Assessment, Trends in International Mathematics and Science Study, Progress in International Reading Literacy Study]; in Germany IQB [Institut zur Qualitätsentwicklung im Bildungswesen]), all of which come to roughly similar results (e.g., Levels et al., 2008; Rindermann & Thompson, 2016; Stanat et al., 2019; all based on student assessment results). In our answer above we also referred to another German sample from around the year 2017 (IQ 84). No one doubts the differences between the countries of origin of migrants, and specifically the connections with the ability levels of immigrants from these countries; (Carabaña, 2011),16 or the consequences of migration policies in the immigration countries (e.g., Singapore or, for certain immigrant groups, the USA; Feliciano, 2005). Hillier-Smith also assumes that the low test results of immigrants and refugees represent the consequences of trauma and stress experienced in the country of origin and during the flight.17 He writes:
Certain refugees’ IQ test scores were lower than the German average, this might not be surprising given the massive disruptive effects of war, persecution, and displacement on schooling [...] as well as the profound trauma experienced by refugees who have been forced to flee because of extensive and severe human rights violations prior to and during the causes of their displacement, as well as whilst they are displaced, risking their lives on perilous journeys to reach safety in the Global North.
For example, long-standing Syrian state repression, persecution, forced disappearances, and killings will have negatively affected education and experience of trauma for the population before the eventual outbreak of full civil war in 2011, and such repression and then civil war itself will also affect the education and trauma of refugees before they are displaced and begin their journeys, as well as those who are not able to flee the state but remain within. (Hillier-Smith, 2024, p. 4)
These are all very plausible hypotheses (also see Turkheimer & Harden, 2024) that we discussed in the article (and see above). According to the assumptions mentioned here, longer periods of time under negative conditions should actually mean a lowered cognitive ability. According to a study by Schoellman (2016), however, this is not the case: He found no association between children’s age at arrival in the United States and their later adult human capital among immigrants from devastating environments (refugee camps, war zones, e.g., Vietnam, Laos and Cambodia). As already mentioned above, environmental conditions, whether favorable or unfavorable for the development of people (from our Western perspective), depend on the characteristics of societies and their people, especially culture and intelligence. The more political-ethical a criterion (e.g., human rights and gender quality vs. patent rates and government effectiveness) the stronger is the correlation with culture vs. cognitive ability (Rindermann & Carl, 2018). And in longitudinal interaction models between the 1980s/1990s and 2010, cognitive ability shows a larger effect on human rights than human rights on cognitive ability (cross-lagged panel analyses, βCA90→HR10 = .27 vs. βHR80→CA10 = .06; Rindermann & Carl, 2018, Figure 7). Human rights develop better in countries with high intelligence; human rights themselves also have a positive effect on intelligence, but this effect is smaller.
One can also compare refugee IQs with the IQs of their region of origin or with the test results of countries in the region where there is no war. For this purpose, we used two recent student achievement dataset collections (e.g., PISA, but also lesser-known regional studies), the results of which we had not included in the article (Altinok & Diebolt, 2024; Gust et al., 2024; their Table A4). Converted into IQ, the results for Egypt (IQ 78, 79) and Jordan (IQ 82, 87) or Nigeria (IQ 67, 69) and Ethiopia (IQ 76, 68) are also not higher than the BOMAT IQs for Syria (IQ 91; N = 223) and Eritrea (IQ 75, N = 39) in the study.18 The regional averages are IQ 81 and 81 for the Arab-Muslim world and IQ 72 and 70 for sub-Saharan Africa.19
To sum it all up, there is no evidence of bias in the selection or testing and no evidence that the results are distorted due to specific conditions of flight, war, schooling (special conditions in the country of refuge). They are simply typical for the respective countries and regions and their peoples and cultures.
4.2.2. Benefits and Costs of Immigration (for the Host Country)
As for costs, Hillier-Smith (2024, pp. 5–6) argues that refugees tend to generate more benefits than costs for the host country:
Overall, refugees’ economic contributions, through work, filling labor shortages, tax revenue, and consumption demand, substantially outweigh the costs of processing asylum claims and initial support. Hillier-Smith (2024, p. 6)
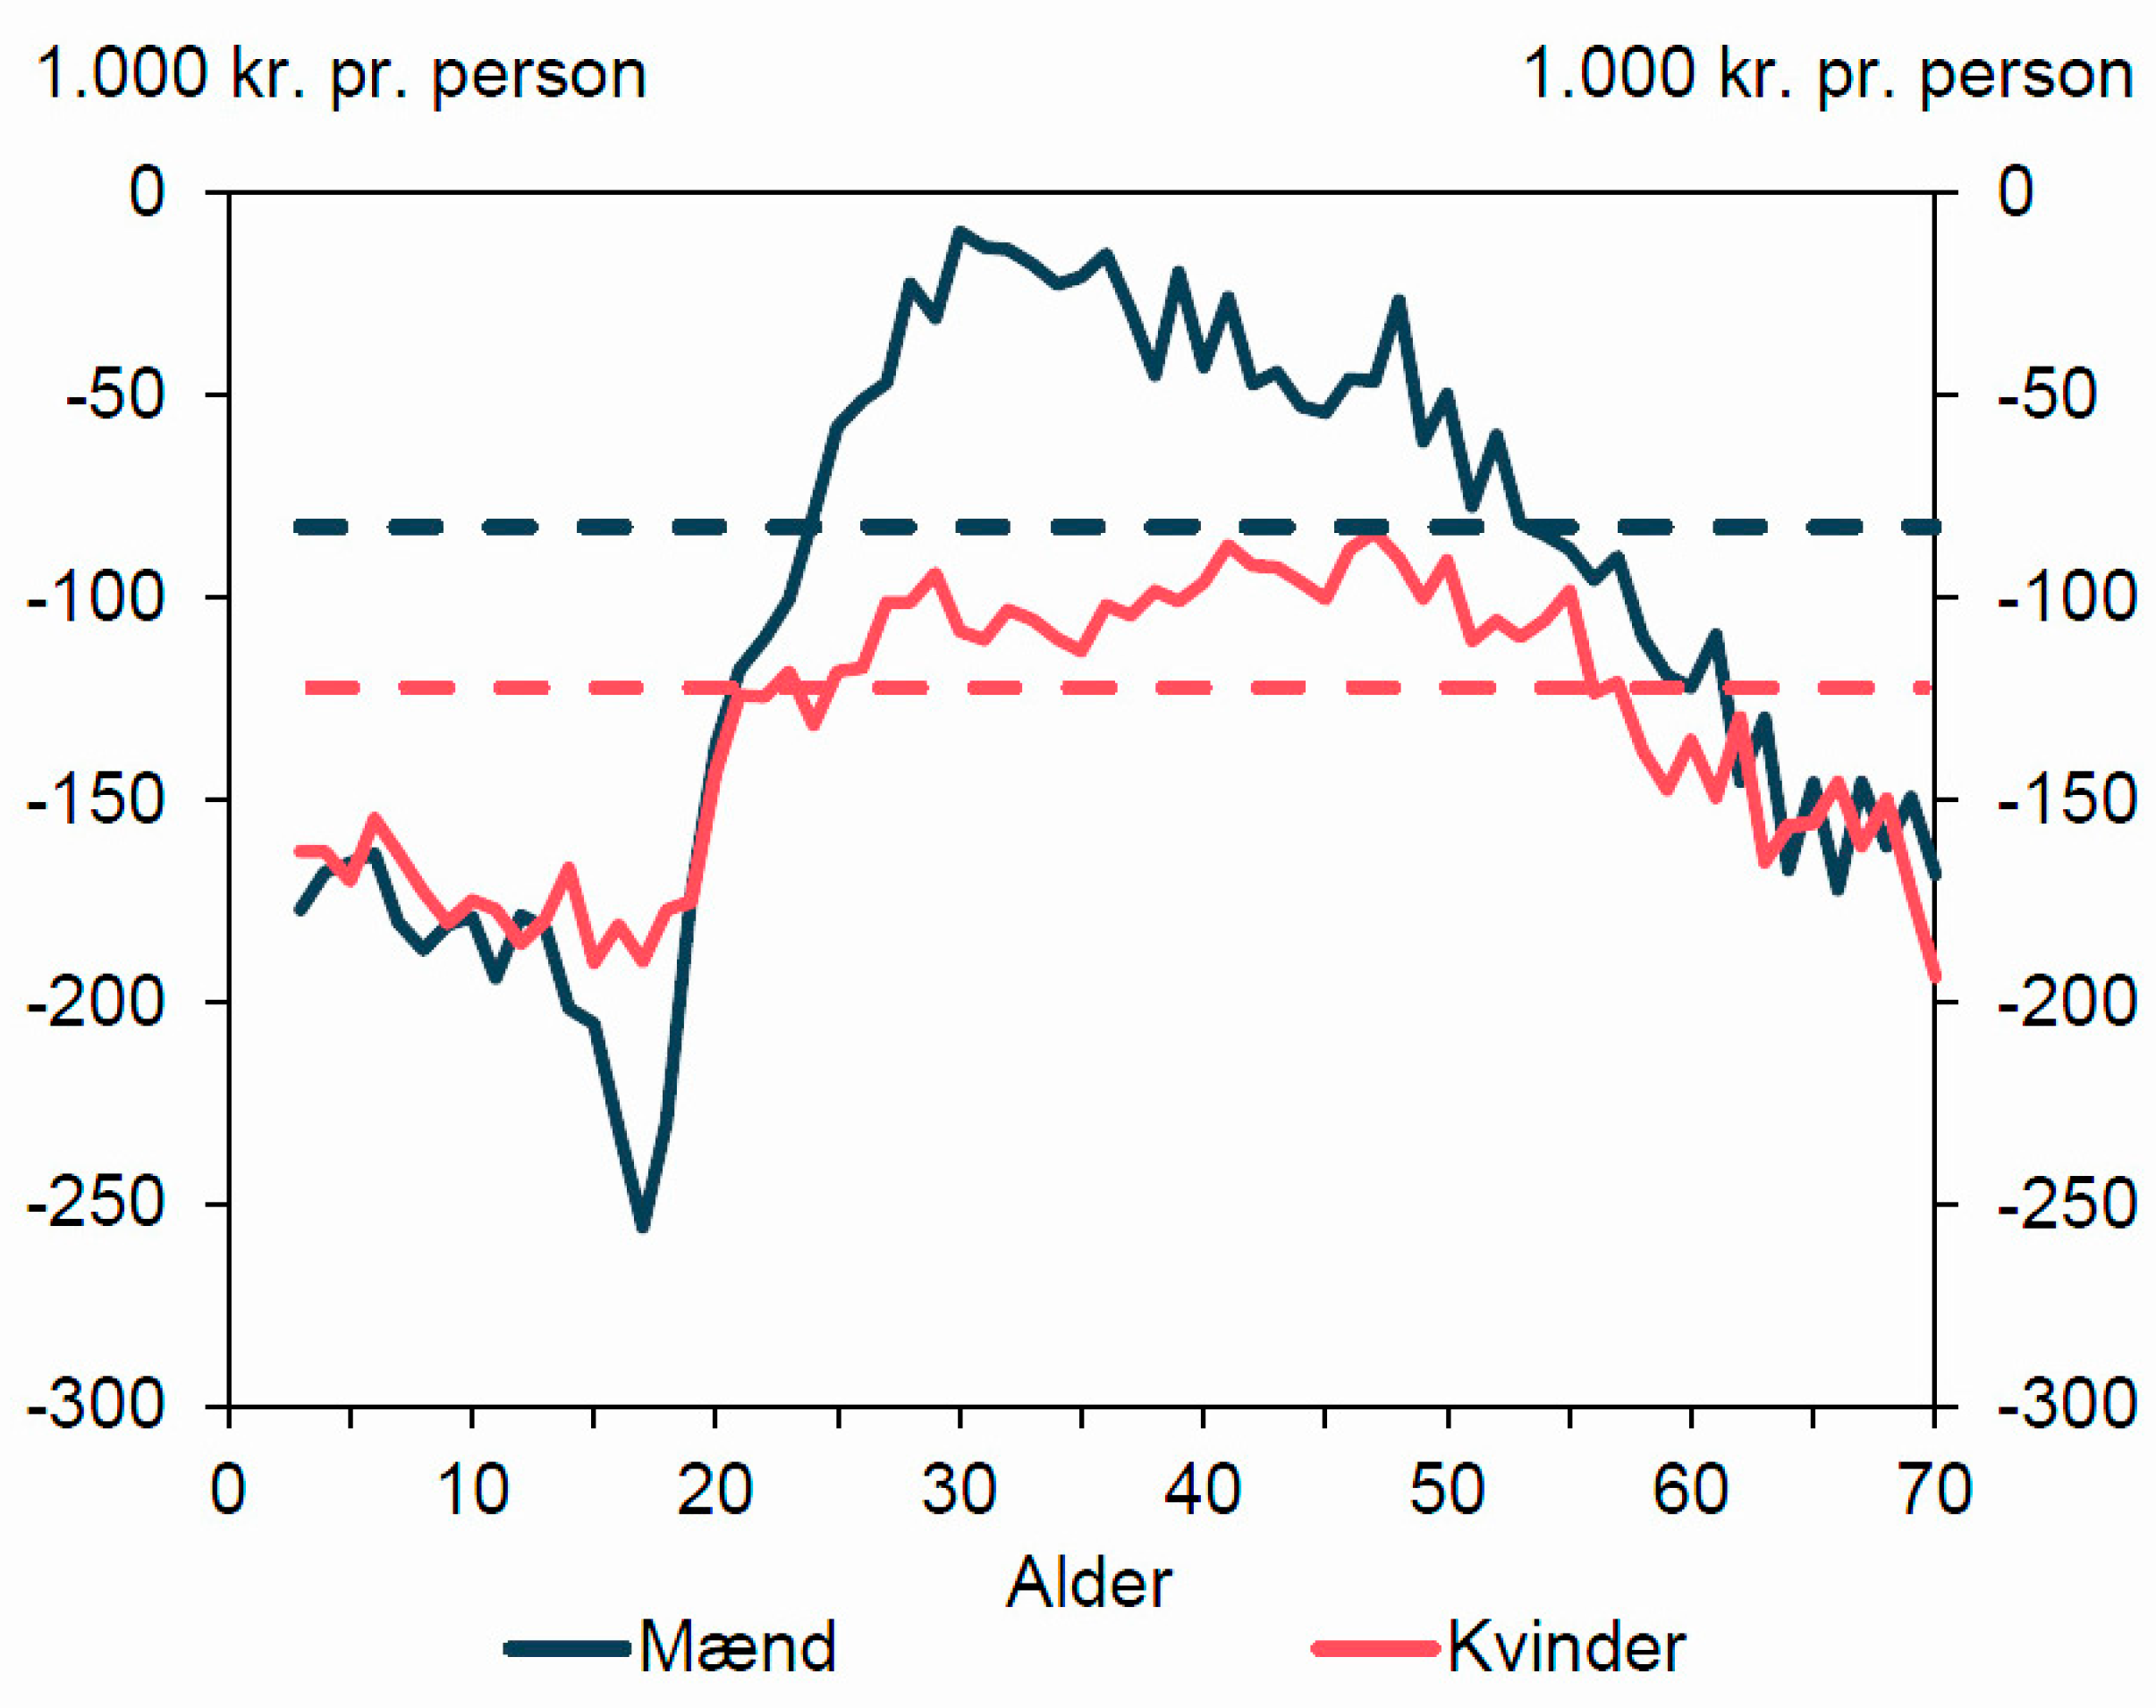
None of us are experts on these economic issues. Hillier-Smith (2024) referred to studies by d’Albis et al. (2018) and Evans and Fitzgerald (2017), both of which, for Western Europe and the USA, find overall positive economic effects of accepting refugees (e.g., macroeconomic impacts are positive, pay more taxes than they receive in benefits). Let us look at the findings from three recent studies, first an official report from the Danish Ministry of Finance (Finansministeriet, 2021). The ministry calculated expenditure and income by age for Danes (“Dansk oprindelse”) and three different immigrant groups by region (“MENAP”: from the Middle East and North Africa, i.e., from Mauritania to Pakistan; “vestlige”: immigrants from Western countries; “øvrige ikke-vestlige”: other non-Western immigrants). As can be seen from Figure 4, children and older people generally cost money, while adults in their late 20s to mid-60s bring in money. This money (which represents goods and services) can be spent on schools and education for the young and on health care and nursing for the elderly, on roads, on the military, or even on migrants from Muslim and other non-Western countries who never (average migrants from MENAP countries at any age) or only in a few years of their lifespan (migrants from other non-Western countries) bring in more income than is spent on them. Looking closely, migrants from Somalia, Syria, Lebanon, Iraq and Afghanistan incur the highest costs, while the highest profits come from migrants from Great Britain, France, the Netherlands, the USA and India (Finansministeriet, 2021, Figure 2.11). Of course, we also have to take age into account20; if this is taken out, the pattern remains the same (MENAP costs are higher than income; Finansministeriet, 2021, Figure 2.8).
Figure 4.
Denmark: average net contribution to public finances by origin and age in 2018. Danish origin (dark blue, highest), Western total (red, second), Other non-Western (gray, third), MENAP countries total (light blue, fourth) (source: Finansministeriet, 2021, their Figure 2.7; see also The Economist, 2021).

In a later report, the Danish Ministry of Finance (Finansministeriet, 2023) focused on refugees (without distinguishing according to origin). They were in the negative range across all age groups, i.e., they contribute less to society than they cost it (see Figure 5).
Figure 5.
Denmark: average net contribution of refugees and family reunified refugees by age and sex in 2019. Men (dark blue, highest), women (red, second) (source: Finansministeriet, 2023, their Figure 4.8).21
Figure 5.
Denmark: average net contribution of refugees and family reunified refugees by age and sex in 2019. Men (dark blue, highest), women (red, second) (source: Finansministeriet, 2023, their Figure 4.8).21
A recent report by Beek et al. (2024), analyzing the situation for the Netherlands, came to similar conclusions (see their Figure 1, Figure 2 and Figure 4). They also analyzed the contributions of subsequent generations; the patterns remained robust and are transmitted through offspring’s educational achievement (an indicator of cognitive ability) which covaries with the region of origin. They summarize:
Western immigrants contributed .9 billion euros overall in 2016 and on-Western immigrants received 18.2 billion euros. ... These numbers would imply a static overall net burden of 17.3 billion, 5.7% of total government expenditures, 2.7% of GDP. (Beek et al., 2024, p. 12)
Particularly costly migrants are those from Somalia, Ethiopia and Eritrea (−€315,000; p. 20) and from Afghanistan, Iran, Syria and Iraq (−€320,000; p. 21; all first generation). Among the second generation “negative outliers are West Africa (–€390,000), the Caribbean (–€435,000), the region of Horn of Africa and Sudan (–€460,000) and Morocco (–€480,000)” (p. 23).
There are conflicting results (those cited by Hillier-Smith and those I cited) and new studies point to high costs. Cost-benefits are undoubtedly related to the characteristics of the countries of origin and the receiving countries.22 Regarding the latter, the less social assistance is paid and the easier it is to find work, the lower the costs and the more benefits immigrants bring.
Finally, I would like to make four plausibility considerations regarding the question of benefits and costs of the given immigration to European countries:
- Intelligence and cognitive ability (intelligence plus relevant knowledge) are the best predictors and causal factors for individual and national economic success. The higher the income, the more they contribute to the community through taxes. If people with lower IQs immigrate, this is likely to lead to economic losses.
- Generational accounting models generally reveal a sustainability gap. The average German citizen costs more than the citizen earns (e.g., Raffelhüschen et al., 2024). If people with lower qualification levels and lower employment rates immigrate, this is likely to lead to even more costs being shifted into the future, i.e. explicit or implicit indebtedness.
- In welfare states, redistribution takes place from the productive middle class to poorer classes, for example through progressive taxes, financing of health insurance according to income and redistribution within the pension system. If people who are more likely to have difficulty in obtaining employment or will have lower incomes immigrate, this must lead to even greater redistribution, i.e., to an increase in health insurance premiums, unemployment insurance and pension contributions while at the same time reducing their benefits.
- In all the publications cited on the benefits and costs of immigration, crime does not appear. However, the costs of crime itself are extremely high. In cost-benefit analyses of preschool programs, crime reduction—when it occurred among program participants as adults—resulted in the greatest financial benefits (Barnett & Masse, 2007). For the Perry Preschool Program (an early intervention program for children from poor and educationally and cognitively weak families), it accounted for about two-thirds of the economic benefits (their Table 2). These benefits include reduced costs for police, courts and prison services and reduced burdens in monetary terms for victims. To take one example, in a current case (at the time of writing this article), it has been reported by Germany’s most important public television news program, the Tagesschau, that the cost of providing round-the-clock surveillance for one dangerous 20-year-old Afghan asylum seeker within the refugee accommodation is 40,000 euros per month.23
This does not mean that it would not be better to get immigrants into work, to qualify them and assist them to be productive in various fields—but their contribution as a group as a whole is likely to be less than that of Western people. If they had not come, the country would have saved money or its citizens would have been richer on average.
4.3. Consideration of the Legitimate Interests of the Residents: None?
“We cannot ignore the consequences of our own actions, even if they are morally motivated.”24
Bradley Hillier-Smith (2024) used the term “obligation” 73 times in his commentary; five of them appear in the abstract, and once in the actual title: “obligations to refugees”. In addition, he speaks of “duty” and “obligations” six times, e.g., as “positive duties owed to refugees”. But not once does he mention the duties of migrants or refugees toward the host society or the duties of politicians toward their citizens. The book he refers to by D. Miller (2016), “Strangers in our midst”, is similar: There is a chapter on “The rights of immigrants”, but no chapter on the rights of the host society and the people living there. But, as Hillier-Smith mentions, the rights of all humans count: “It has been long- and well-established that all persons have equal moral worth” (Hillier-Smith, 2024, p. 6).
In addition, Hillier-Smith (2024) emphasizes several times that the cost of protecting the refugees is minimal for the host population: “at relatively little cost” (three times on p. 12). And: “There is a widely accepted robust moral constraint against harming or violating the rights of innocent people (indeed, it is perhaps the most fundamental commitment in common morality)” (Hillier-Smith, 2024, p. 12). He can rely on an influential article by Peter Singer:
If it is in our power to prevent something bad from happening, without thereby sacrificing anything of comparable moral importance, we ought, morally, to do it. By “without sacrificing anything of comparable moral importance” I mean without causing anything else comparably bad to happen, or doing something that is wrong in itself, or failing to promote some moral good, comparable in significance to the bad thing that we can prevent. (Singer, 1972, p. 231)
In his section 4 (Hillier-Smith, 2024, pp. 9–13) he describes in detail and emphatically the often harsh and terrible fates of refugees, their situation in their countries of origin, during their flight and in the host country. In contrast, he does not mention the fate of the people in the host countries, nor does he address their rights. And he writes again and again about “little costs”. For some, however, these “little costs” mean the loss of their lives. There are many, many sacrifices here of comparable moral significance. If Hillier-Smith describes the fate of migrants over many pages, which I and we all should acknowledge, then it should also be permissible to describe the sacrifices of the people in the host societies, and it is morally imperative that these sacrifices are acknowledged and recognized:25
Just as I started writing this article, an Afghan asylum seeker deliberately drove at high speed into a crowd of people, including children (in a demonstration by the left-wing trade union Verdi in Munich, 13 February 2025). A two-year-old girl and her mother (from Algeria), who were lying under the car, died. There were about 30 injured persons.26
There have been many, many similar incidents, which I will include, for those interested in the shocking details, in an Appendix A. All of this and every single event is shocking, intolerable, completely unacceptable and in no way justifiable as a situation brought about in Europe. Victims are not only the dead and injured, but also their relatives, paramedics, police officers, observers and all those and their relatives who could have become victims and only did not become victims by chance. These are not “little costs” and they are also “violating the rights of innocent people (indeed, it is perhaps the most fundamental commitment in common morality)” (Hillier-Smith, 2024, p. 12).
These developments were not unforeseeable. Something similar was described decades ago in dystopian articles and books, but in milder versions that underplayed the coming horrors. Their authors became controversial and therefore—so it was thought—could be ignored.27 A more journalistic piece also came from me (Rindermann, 2015).28 What has happened is even worse than predicted: the idea of someone driving a vehicle through crowds at festivals used to be unthinkable.
Of course it is possible to put forward counter-arguments. Perhaps one or the other number is biased. As mentioned, a higher proportion of refugees are young and male. Of all people, 99%, including young male refugees, are peaceful and friendly for 99% of their lifetime. For 99% of the victims’ lives, they were not victims. It is often pointed out that the acts were committed by people who had mental health problems (including some of the examples given in the appendix). Although the risks of violence are indeed increased in certain mental illnesses (this applies in particular to schizophrenia spectrum disorders), mental illnesses can explain only a very small fraction of general violence (Ahonen et al., 2019; Whiting et al., 2021). Certainly, there has been violence in football in Europe before, for example in 1998 when a French policeman was kicked and punched in the head by German hooligans. He was left with a permanent disability. “The attack was deemed a national shame by Chancellor of Germany Helmut Kohl. In the years since, [the French policeman] Nivel has been a guest of honor at Germany football matches and a foundation in his name has opposed football hooliganism.”29 Have we seen such a reaction in the case of immigrant violence?
But all these objections are irrelevant. Existing violence is no justification for letting immigrants increase it further. Biased (racist etc.) reporting does not mean that there is only a negligible amount of crime. These objections are misused as strategies for refusing to perceive reality.
The costs of immigration are not only economic. Other concerns of the host countries and their populations, the legitimate interests of their people, must be recognized. Does Hillier-Smith acknowledge them, indeed does he perceive them at all? Just as we recognize and empathize with the fate of some who seek to flee their countries of origin, so we must also recognize the fate of some residents of the receiving countries.
4.4. The Ethical Problem at Its Core
At the center of the moral controversy over whether a country should accept refugees is that the rights and interests of different people are in competition with each other. The legitimate interests of the present residents of the receiving country are in competition with the legitimate interests of the migrants.
The usual reactions to this problem are to ignore it (to pass over it with silence), trivialize it (it’s not all that bad), twist it into the positive (“enrichment”) or stigmatize those who point it out (evil, stupid, racist). For example, the leading German politician of The Left party,30 Gregor Gysi, commented on the numerous murders recently committed by migrants in Magdeburg, Aschaffenburg and Munich: “Murders by Germans also happen here all the time.”31
The classic ethical answer is: All humans are equal. “It has been long- and well-established that all persons have equal moral worth.” (Hillier-Smith, 2024, p. 6) Thinking and acting here is guided by universal ethical principles that encompass all of humanity. An example could be the behavior of the parents who, after the murder of their daughter (who is said to have been also active in refugee aid) by an Afghan refugee, established a foundation that supports students, including foreign students and students with refugee backgrounds, with a focus on development aid and student internships in developing countries.32 These parents are taking care of others, investing resources, money and time, so that people who are not part of their family are supported. This is exactly according to the model of universalist ethics that treats all people equally. However, this is fundamentally at odds with widely practiced rules of morality. In a sample of 60 different societies, the following ethical orientations and practices were found to be widespread worldwide (Curry et al., 2019):
- Supporting one’s family (e.g., being a loving mother or protective father).33
- Supporting one’s own social group (e.g., forming friendships and alliances, giving preferential treatment to members of your group).
- Engaging in reciprocal cooperation (e.g., returning a favor, paying a debt).
At the heart of morality here is cooperation, for the benefit of all involved, which has developed because morality as cooperation benefits those who practice it and their offspring. In contrast, it can be argued that to practice purely universal morality will be harmful in the long term; or even that it is immoral because it places excessive burdens and risks on those close to us and those who depend on us.
The refugee policy currently practiced in Germany and some other countries is contrary to these widely practiced rules of morality. The host communities concerned are inflicting costs on themselves, and the policy has terrible, harrowing and fatal consequences for some of their members. In our political and private actions, we must be guided by sustainable and long-term viable principles. This also applies to politicians, who in many countries are constitutionally obliged to ensure the welfare of the citizens and residents of their country.34
This does not mean that the claims of others, even those distant from us, are null and void; however, these claims must be balanced against one another and more strongly oriented toward the well-being of those for whose existence we are responsible. We need an ethic of personal responsibility—an ethic of commitment toward those who would not exist without us, whose well-being we are responsible for, and who depend on us—then toward our partners, parents, relatives, friends, neighbors, and loved ones, who would also help us in times of need (reciprocity). Expanding the circle of those whose interests are to be considered does not release us from our responsibility toward those close to us and dependent on us; and in considering the interests of others, we must in no circumstances endanger their life and well-being.
Funding
This research received no external funding.
Conflicts of Interest
The author declares no conflict of interest. But of course, I have an existential interest in ensuring that neither I nor my family are harmed by immigration. Psychologists, doctors, and scientists, however, have already been harmed (see Appendix A).
Appendix A. Examples of Violent Crimes Committed by Immigrants
- –
- –
- There are knife attacks and mass stabbings against random visitors at public festivals, e.g., at the “Festival of Diversity” in Solingen by a Syrian asylum seeker (three dead, 23 August, 2024).37
- –
- Knife attacks also occur at other events, such as a Syrian attacking visitors at a public viewing of the European Football Championship (27 June, 2024).38 At a private garden party in Wolmirstedt, where the European Championship match of the German national football team was being broadcast on television, an Afghan refugee broke into the yard and stabbed the party guests with a knife; he was subsequently shot dead by the police. Before that, he had stabbed another Afghan to death (16 June, 2024).39
- –
- People are attacked in public with machetes or swords. In Ludwigshafen a man from Somalia: “The attacker cut off one of the 20-year-old’s forearms and threw it onto the balcony of his ex-girlfriend, who lives nearby.”40 “In Stuttgart, a Syrian kills his former roommate in the street with a sword. ... The victim’s daughter (aged 11) witnesses the attack.”41
- –
- Because violence and sexual assaults occur at city festivals, often by migrants, city festivals are canceled or not held at all (e.g., in my city Chemnitz August 2017, 2018 and 2019).42
- –
- Because the security requirements for festivals and carnival parades are increasing (e.g., the erection of popularly known “Merkel bollards”) and their fulfillment is sometimes too expensive, some are canceled.43
- –
- On trains, train staff are threatened and physically attacked by refugees. They said: “Our colleague had to continue the journey to Suhl station in fear of death and in a railcar heavily contaminated with human blood.”44 On 25 January, 2023, a mass stabbing occurred on a train. A newly in love couple (17 and 19 years old) was stabbed to death by a Palestinian refugee, eight others were injured.45
- –
- Violence also occurs at train stations: A Turk shot another Turk in the middle of the platform between waiting travelers at Frankfurt Central Station.46 An Eritrean refugee pushed an eight-year-old child (completely unknown to him) and his mother in front of an incoming train in Frankfurt; the child died.47
- –
- There are mass brawls and sexual assaults by migrants in swimming pools. Swimming pools need security staff, sometimes the police have to come and clear the pools.48 I have an almost 90-year-old uncle who lived in four different German-speaking countries, in Nazi Germany in his childhood, in the socialist GDR in his youth, during his studies in capitalist West Germany and then in Austria in his adult life. He has also traveled extensively and worldwide in his adult life, in Europe, the Americas, Africa and Asia. I asked him if he had ever seen security staff in an outdoor pool or swimming pool in his entire life. He initially misunderstood the question, asking if there were pool attendants and lifeguards, yes of course there were, but never security or police anywhere. However, this has not been uncommon in Germany since 2016.
- –
- Even German supermarkets now have security staff from time to time, which did not happen in the past.
- –
- In regional league soccer, there is violence from players or spectators or both together against others and the referee. Jewish soccer clubs in particular need police protection during matches.49 A son of the well-known SPD politician Ralf Stegner was beaten up by Kurdish players.50 In the youth league, a Moroccan player inflicted severe brain injuries on another player, which led to his death.51
- –
- Some schools now also have security staff or the police have to move in; one quote: “There was another escalation at the Friedrich Bergius School in Berlin-Friedenau on Wednesday. A boy from the seventh grade had to flee to a supermarket because he was ‘chased’ by teenagers with knives, baseball bats and brass knuckles. ... According to the school administration, the pursuers shouted ‘We’ll stab you’. The school is also said to have received a threatening letter in Arabic. ... There were 90 young people involved in the chase. The police had to deploy hundreds of officers.”52 School lessons become difficult. Teachers are also threatened. A German teacher for refugees was (presumably) murdered by an Iranian refugee.53
- –
- –
- A professor at my university and chief hospital director was so seriously injured by Syrian and Iranian refugee youths that emergency surgery was required.56 A researcher in intercultural communication from the same university was robbed on her way home: “She was particularly shocked by the fact that the alleged perpetrator was a migrant, the researcher explained on her Twitter channel.”57
- –
- In universities, female students were raped by refugees or migrants.58
- –
- –
- While working as a psychotherapist, a psychologist from Iraq was stabbed to death by a Syrian asylum seeker.61
- –
- Other victim groups include homosexuals, sexual minorities, Jews, priests, girls, women, schoolmates, firefighters, paramedics, doctors, police officers, critics of Islam, children in playgrounds, children in crèches, old people, young people, refugee aid workers, refugee shelter operators, men, migrants, Germans. Attacks occur in gardens and on roads, in parks and at festivals, in swimming pools and on squares, in churches and on playgrounds, in Holocaust memorials and at railway stations, in trains and on platforms, in underground car parks and on sidewalks, in homes and in schools. This can all be found in reports. But the psychological stress, the terribleness of the acts, the horror is rarely made clear. Perhaps a harrowing quote on the murder of a two-year-old child by an Afghan refugee: “According to previous investigations, the 28-year-old grabbed a two-year-old boy of Moroccan origin sitting in a handcart, ‘took off his cap and scarf and then stabbed the boy at least seven times in the neck and shoulder area with a 32-centimeter-long kitchen knife without further notice’. The child died.”62 Oh my God. What a world. What people. I have a handcart myself and have often transported my children with it. Whenever I see the handcart or see groups of children walking through the city, like yesterday, I think of this incident (and also today).
- –
- Politicians and leading civil servants have also been victims, such as a young politician from The Left who was sexually abused by presumably Arabs on a playground. She initially blamed Germans for this to the police: “I lied because I was afraid that the rape would be misused by the right to further fuel the agitation against refugees, which has risen dramatically since the incidents in Cologne on New Year’s Eve [2015].”63 In January 2025, a CDU junior politician was killed by a asylum seeker from Guinea (“throat slit”).64 Cem Özdemir, a Green politician of Turkish origin and minister in the German government, complained about the sexual harassment of his daughter by migrants. In his words: “When she is out and about in the city, she or her friends are often unpleasantly ogled or sexualized by men with a migrant background. ... Anyone who can and wants to make a valuable contribution to our country is welcome. We help those who are demonstrably seeking protection. We have no room for anyone else.”65 In 2016, the daughter of a leading German EU lawyer, a medical student who reportedly was active in development cooperation and refugee aid, was sexually abused and killed by an Afghan refugee. The parents then set up a foundation bearing the name of their murdered child, “expressly also supporting refugees”.66
- –
- Migrants are disproportionately involved in gang and mass rape. “During the 2015–2016 celebrations of New Year’s Eve in Germany, approximately 1,200 women were reported to have been sexually assaulted, especially in the city of Cologne. In many of the incidents, while these women were in public spaces, they were surrounded and assaulted by large groups of men who were identified by officials as Muslim men of Arab or North African origin.”67 The proportion of non-German (passport) suspects has been around 50% or more for years. However, their share of the population (in the example of Bavaria) is only 15%, so they are clearly disproportionately represented.68
- –
- Migrants and refugees in particular are disproportionately often involved in violent crime: In 2023, there were 14.1 million foreigners (16.89%) and 2,934,850 refugees (3.47%) out of a total population of around 83.5 million people in Germany. In 2023, there were 2,789 suspects in homicides, of which 1,221 were foreigners (44%, a factor of 2.59 higher than their share of the population) and 395 refugees (14%, factor 4.08 higher). There were 10,295 suspects in rape, of which 3,834 were foreigners (37%, factor 2.20) and 1,193 refugees (12%, factor 3.33). There were 153,475 suspects in assault, of which 63,225 were foreigners (41%, factor 2.44) and 20,375 refugees (13%, factor 3.38).69 The crime rates of migrants and refugees are above the average for Western countries.70
References
- Adema, J.; Alipour, J.-V. Steigert Migration die Kriminalität? Ein datenbasierter Blick. [Does migration increase crime? A data-based perspective.]; ifo Schnelldienst, 2025. [Google Scholar]
- Ahonen, L.; Loeber, R.; Brent, D. The association between serious mental health problems and violence: Some common assumptions and misconceptions. Trauma, Violence, & Abuse 2019, 20(5), 613–625. [Google Scholar] [CrossRef]
- Altinok, N.; Diebolt, C. Cliometrics of learning-adjusted years of schooling: Evidence from a new dataset. Cliometrica 2024, 18(3), 691–764. [Google Scholar] [CrossRef]
- Ashraf, Q. H.; Galor, O. The macrogenoeconomics of comparative development. Journal of Economic Literature 2018, 56(3), 1119–1155. [Google Scholar] [CrossRef]
- Backhaus, K.; Erichson, B.; Gensler, S.; Weiber, R.; Weiber, T. Multivariate Analysemethoden. [Multivariate analysis methods.]; Springer, 2023. [Google Scholar]
- Barel, E.; Van IJzendoorn, M. H.; Sagi-Schwartz, A.; Bakermans-Kranenburg, M. J. Surviving the Holocaust: A meta-analysis of the long-term sequelae of a genocide. Psychological Bulletin 2010, 136(5), 677–698. [Google Scholar] [CrossRef] [PubMed]
- Barnett, W. S.; Masse, L. N. Comparative benefit-cost analysis of the Abecedarian program and its policy implications. Economics of Education Review 2007, 26, 113–125. [Google Scholar] [CrossRef]
- Beals, K. L.; Smith, C. L.; Dodd, S. M. Brain size, cranial morphology, climate, and time machines. Current Anthropology 1984, 25(3), 301–330. [Google Scholar] [CrossRef]
- Becker, D.; Rindermann, H. The relationship between cross-national genetic distances and IQ-differences. Personality and Individual Differences 2016, 98, 300–310. [Google Scholar] [CrossRef]
- Beek, J. v. d.; Hartog, J.; Kreffer, G.; Roodenburg, H. The long-term fiscal impact of immigrants in the Netherlands, differentiated by motive, source region and generation. IZA Discussion Paper, 17569. 2024. Available online: link to the article (accessed on 20 February 2025).
- Ben-Hur, S.; Bris, A.; Caballero, J. What drives brain drain and brain gain? The main factors behind talent flows, based on competitiveness data; International Institute for Management Development (IMD), 2017. [Google Scholar]
- Biasutti, R. Le razze e i popoli della terra. [Races and peoples of the earth.]; Union Tipografico-Editrice, 1967. [Google Scholar]
- Bundeskriminalamt. Kriminalität im Kontext von Zuwanderung. Fokus: Fluchtmigration Bundeslagebild 2023. [Crime in the context of immigration. Focus: Refugee migration Federal Situation Report 2023.]; Bundeskriminalamt (BKA), 2024. [Google Scholar]
- Bundesministerium des Innern. Polizeiliche Kriminalstatistik 2023. [Police Crime Statistics 2023.]; Bundesministerium des Innern und für Heimat, 2024. [Google Scholar]
- Caplan, B. The case against education. Why the education system is a waste of time and money; Princeton University Press, 2018. [Google Scholar]
- Carabaña, J. Why do the results of immigrant students depend so much on their country of origin and so little on their country of destination? In PISA under examination. Changing knowledge, changing tests, and changing schools; Pereyra, M. A., Kotthoff, H.-G., Cowen, R., Eds.; Sense, 2011; pp. 207–221. [Google Scholar] [CrossRef]
- Cavalli-Sforza, L. L.; Menozzi, P.; Piazza, A. The history and geography of human genes; Princeton University Press, 1994. [Google Scholar]
- Charlton, B. G. Replacing education with psychometrics: How learning about IQ almost-completely changed my mind about education. Medical Hypotheses 2009, 73, 273–277. [Google Scholar] [CrossRef]
- Cohen, J. The earth is round (p < 0.05). American Psychologist 1994, 49, 997–1003. [Google Scholar] [CrossRef]
- Cohen, J.; Cohen, P.; West, S. G.; Aiken, L. S. Applied multiple regression/correlation analysis for the behavioral sciences; Lawrence Erlbaum, 2003. [Google Scholar] [CrossRef]
- Coyle, Th. R.; Rindermann, H.; Hancock, D. Cognitive capitalism: Economic freedom moderates the effects of intellectual and average classes on economic productivity. Psychological Reports 2016, 119(2), 411–427. [Google Scholar] [CrossRef]
- Curry, O. S.; Mullins, D. A.; Whitehouse, H. Is it good to cooperate? Testing the theory of morality-as-cooperation in 60 societies. Current Anthropology 2019, 60(1), 47–69. [Google Scholar] [CrossRef]
- d’Albis, H.; Boubtane, E.; Coulibaly, D. Macroeconomic evidence suggests that asylum seekers are not a “burden” for Western European countries. Science Advances 2018, 4(6), eaaq0883. [Google Scholar] [CrossRef]
- Davis, B. The moralistic fallacy. Nature 1978, 272(5652), 390. [Google Scholar] [CrossRef]
- DeGroot, A. D. War and the intelligence of youth. Journal of Abnormal and Social Psychology 1951, 46, 596–597. [Google Scholar] [CrossRef]
- Evans, W. N.; Fitzgerald, D. The economic and social outcomes of refugees in the United States: Evidence from the ACS (NBER Working Paper, 23498); National Bureau of Economic Research, 2017. [Google Scholar] [CrossRef]
- Falk, R.; Greenbaum, Ch. W. Significance tests die hard. The amazing persistence of a probabilistic misconception. Theory & Psychology 1995, 5, 75–98. [Google Scholar] [CrossRef]
- Feliciano, C. Educational selectivity in US immigration: How do immigrants compare to those left behind? Demography 2005, 42(1), 131–152. [Google Scholar] [CrossRef] [PubMed]
- Finansministeriet. Økonomisk analyse: Indvandreres nettobidrag til de offentlige finanser i 2018. [Economic Analysis: Immigrants’ net contribution to public finances in 2018.]; Finansministeriet, 2021. [Google Scholar]
- Finansministeriet. Økonomisk analyse: Indvandreres nettobidrag til de offentlige finanser i 2019—revideret version (September 2023). [Economic Analysis: Immigrants’ net contribution to public finances in 2019—revised version (September 2023).]; Finansministeriet, 2023. [Google Scholar]
- Geiser, C. Factor model with only 2 indicators? [Video]; YouTube, 10 October 2023. Available online: link to the article (accessed on 20 February 2025).
- Gigerenzer, G. Mindless statistics. Journal of Socio-Economics 2004, 33, 587–606. [Google Scholar] [CrossRef]
- Gignac, G. E.; Bates, T. C. Brain volume and intelligence. Intelligence 2017, 64, 18–29. [Google Scholar] [CrossRef]
- Gust, S.; Hanushek, E. A.; Woessmann, L. Global universal basic skills: Current deficits and implications for world development. Journal of Development Economics 2024, 166, 103205. [Google Scholar] [CrossRef]
- Henrich, J. P. The WEIRDest people in the world: How the West became psychologically peculiar and particularly prosperous; Farrar, Straus and Giroux, 2020. [Google Scholar]
- Hillier-Smith, B. On what matters for obligations to refugees. Journal of Controversial Ideas 2024, 4(2), 19. [Google Scholar] [CrossRef]
- Hornung, E. Immigration and the diffusion of technology: The Huguenot diaspora in Prussia. American Economic Review 2014, 104(1), 84–122. [Google Scholar] [CrossRef]
- Hunter, J. E. Needed: A ban on the significance test. Psychological Science 1997, 8, 3–7. [Google Scholar] [CrossRef]
- Jablonski, N. G.; Chaplin, G. The evolution of human skin coloration. Journal of Human Evolution 2000, 39, 57–106. [Google Scholar] [CrossRef]
- Jones, G.; Schneider, W. J. IQ in the production function: Evidence from immigrant earnings. Economic Inquiry 2010, 48(3), 743–755. [Google Scholar] [CrossRef]
- Kapur, D.; McHale, J. Give us your best and brightest: The global hunt for talent and its impact on the developing world; Center for Global Development, 2005. [Google Scholar]
- Kirkegaard, E. O. W. Mathematical ability of Norwegian immigrants is predictable from country of origin. Mankind Quarterly 2023, 64, 347–353. [Google Scholar] [CrossRef]
- Kirkegaard, E. O. W. German immigrant IQ is about 85 according to new study. Also according to prior studies. Clear Language, Clear Mind. 31 October 2024. Available online: link to the article (accessed on 20 February 2025).
- Kodila-Tedika, O.; Asongu, S. A. Genetic distance and cognitive human capital: A cross-national investigation. Journal of Bioeconomics 2016, 18(1), 33–51. [Google Scholar] [CrossRef]
- Lee, J. J.; McGue, M.; Iacono, W. G.; Michael, A. M.; Chabris, C. F. The causal influence of brain size on human intelligence: Evidence from within-family phenotypic associations and GWAS modeling. Intelligence 2019, 75, 48–58. [Google Scholar] [CrossRef] [PubMed]
- León, F. R.; Burga-León, A. How geography influences complex cognitive ability. Intelligence 2015, 50, 221–227. [Google Scholar] [CrossRef]
- Levels, M.; Dronkers, J.; Kraaykamp, G. Immigrant children’s educational achievement in Western countries: Origin, destination, and community effects on mathematical performance. American Sociological Review 2008, 73, 835–853. [Google Scholar] [CrossRef]
- Lynn, R. The role of nutrition in secular increases in intelligence. Personality and Individual Differences 1990, 11, 273–285. [Google Scholar] [CrossRef]
- MacDonald, K. Individualism and the Western liberal tradition: Evolutionary origins, history, and prospects for the future; Kindle Direct Publishing, 2019. [Google Scholar]
- Marie, O.; Pinotti, P. Immigration and crime: An international perspective. Journal of Economic Perspectives 2024, 38(1), 181–200. [Google Scholar] [CrossRef]
- Matthews, L. J.; Tabery, J.; Turkheimer, E. How to diagnose abhorrent science. Hastings Center Report 2024, 54(6), 18–29. [Google Scholar] [CrossRef]
- McMahan, J.; Minerva, F.; Singer, P. Editorial. Journal of Controversial Ideas 2024, 4(2), 21. [Google Scholar] [CrossRef]
- Miller, D. Strangers in our midst; Harvard University Press, 2016. [Google Scholar]
- Miller, G. Spent: Sex, evolution and consumer behaviour; Viking, 2009. [Google Scholar]
- Moser, P.; Voena, A.; Waldinger, F. German Jewish émigrés and US invention. American Economic Review 2014, 104(10), 3222–3255. [Google Scholar] [CrossRef]
- Murray, Ch. Real education: Four simple truths for bringing America’s schools back to reality; Crown Forum, 2008. [Google Scholar]
- Naipaul, V. S. Among the believers: An Islamic journey; André Deutsch, 1981. [Google Scholar]
- Oldman, O.; Pomp, R. The brain drain: A tax analysis of the Bhagwati proposal. World Development 1975, 3(10), 751–763. [Google Scholar] [CrossRef]
- Ousley, S.; Jantz, R.; Freid, D. Understanding race and human variation. American Journal of Physical Anthropology 2009, 139(1), 68–76. [Google Scholar] [CrossRef] [PubMed]
- Pemberton, T. J.; DeGiorgio, M.; Rosenberg, N. A. Population structure in a comprehensive genomic data set on human microsatellite variation. G3 (Bethesda) 2013, 3(5), 891–907. [Google Scholar] [CrossRef]
- Pollet, T. V. Much ado about p. What does a p-value mean when testing hypotheses with aggregated cross-cultural data in the field of evolution and human behavior? Frontiers in Psychology 2013, 4(734), 1–3. [Google Scholar] [CrossRef]
- Raffelhüschen, B.; Seuffert, S.; Wimmesberger, F. Ehrbarer Staat? Fokus Migration. Zur fiskalischen Bilanz der Zuwanderung. [Honorable state? Focus on migration. On the fiscal balance of immigration.], Argumente zu Marktwirtschaft und Politik Nr. 173. 2024.
- Rindermann, H. Formen wissenschaftlicher Auseinandersetzung. [Forms of scientific disputes.]. Erwägen-Wissen-Ethik 2006, 17(2), 251–263 and 313–321. [Google Scholar]
- Rindermann, H. Ingenieure auf Realschulniveau. [Engineers at the level of middle school students.]. Focus 2015, 23(43), 42–44. Available online: link to the article (accessed on 17 October 2015). [Google Scholar]
- Rindermann, H. Cognitive capitalism: Human capital and the wellbeing of nations; Cambridge University Press, 2018. [Google Scholar] [CrossRef]
- Rindermann, H. The advantages of having a minority viewpoint in politicized psychology: A case study of intelligence research. In Ideological and political bias in psychology: Nature, scope, and solutions; Frisby, C. L., Redding, R., O’Donohue, W. T., Lilienfeld, S. O., Eds.; Springer, 2023; pp. 709–741. [Google Scholar] [CrossRef]
- Rindermann, H.; Becker, D. The future of intelligence: A prediction of the Flynn effect based on past student assessment studies until the year 2100. Personality and Individual Differences 2023, 206, 112110. [Google Scholar] [CrossRef]
- Rindermann, H.; Carl, N. Human rights: Why countries differ. Comparative Sociology 2018, 17, 29–69. [Google Scholar] [CrossRef]
- Rindermann, H.; Ceci, S. J. Parents’ education is more important than their wealth in shaping their children’s intelligence: Results of 19 samples in seven countries at different developmental levels. Journal for the Education of the Gifted 2018, 41(4), 298–326. [Google Scholar] [CrossRef]
- Rindermann, H.; Klauk, B.; Thompson, J. Intelligence of refugees in Germany: Levels, differences and possible determinants. Journal of Controversial Ideas 2024, 4(2), 20. Appendix: link to the article. [Google Scholar] [CrossRef]
- Rindermann, H.; Schott, T.; Baumeister, A. E. E. FLynn effect in Turkey: A comment on Kagitcibasi & Biricik (2011). Intelligence 2013, 41(3), 178–180. [Google Scholar] [CrossRef]
- Rindermann, H.; Thompson, J. Ability rise in NAEP and narrowing ethnic gaps? Intelligence 2013, 41(6), 821–831. [Google Scholar] [CrossRef]
- Rindermann, H.; Thompson, J. The cognitive competences of immigrant and native students across the world: An analysis of gaps, possible causes and impact. Journal of Biosocial Science 2016, 48(1), 66–93. [Google Scholar] [CrossRef]
- Rindermann, H.; Woodley, M. A.; Stratford, J. Haplogroups as evolutionary markers of cognitive ability. Intelligence 2012, 40(4), 362–375. [Google Scholar] [CrossRef]
- Schoellman, T. Early childhood human capital and development. American Economic Journal: Macroeconomics 2016, 8(3), 145–174. [Google Scholar] [CrossRef]
- Schulz, J. F. Kin networks and institutional development. The Economic Journal 2022, 132(647), 2578–2613. [Google Scholar] [CrossRef]
- Shriver, M. D.; Parra, E. J.; Dios, S.; Bonilla, C.; Norton, H.; Jovel, C.; Pfaff, C.; Jones, C.; Massac, A.; Cameron, N.; Baron, A.; Jackson, T.; Argyropoulos, G.; Jin, L.; Hoggart, C. J.; McKeigue, P. M.; Kittles, R. A. Skin pigmentation, biogeographical ancestry and admixture mapping. Human Genetics 2003, 112, 387–399. [Google Scholar] [CrossRef]
- Singer, P. Famine, affluence, and morality. Philosophy & Public Affairs 1972, 1(3), 229–243. [Google Scholar]
- Singer, P. Offene Grenzen wären ein Fehler, auch moralisch. [Open borders would be a mistake, also morally.]; Die Zeit, 2 November 2024. Available online: link to the article (accessed on 20 February 2025).
- Spence, M. Job market signaling. Quarterly Journal of Economics 1973, 87(3), 355–374. [Google Scholar] [CrossRef]
- Spolaore, E.; Wacziarg, R. The diffusion of development. Quarterly Journal of Economics 2009, 124(2), 469–529. [Google Scholar] [CrossRef]
- Spolaore, E.; Wacziarg, R. Ancestry and development: New evidence. Journal of Applied Econometrics 2018, 33(5), 748–762. [Google Scholar] [CrossRef]
- Stanat, P.; Schipolowski, S.; Mahler, N.; Weirich, S.; Henschel, S. IQB-Bildungstrend 2018. [IQB trend in education 2018.]; Waxmann, 2019. [Google Scholar]
- Tadmouri, G. O.; Nair, P.; Obeid, T.; Ali, M. T. A.; Khaja, N. A.; Hamamy, H. A. Consanguinity and reproductive health among Arabs. Reproductive Health 2009, 6(17), 1–9. [Google Scholar] [CrossRef] [PubMed]
- Templer, D. I.; Arikawa, H. Temperature, skin color, per capita income, and IQ: An international perspective. Intelligence 2006, 34, 121–128. [Google Scholar] [CrossRef]
- Tezuka, S. Cognitive distortions. How the culture wars came for Wikipedia’s articles about human intelligence. Quillette. 18 July 2022. Available online: link to the article (accessed on 20 February 2025).
- The Economist. Why have Danes turned against immigration? Many fear that refugees are a drain on their welfare state. The Economist. 18 December 2021. Available online: link to the article (accessed on 20 February 2025).
- Turkheimer, E. Race and IQ. Cato Unbound. 21 November 2007. Available online: link to the article (accessed on 20 February 2025).
- Turkheimer, E. The role of statistical competence in peer review; Eric Turkheimer—Gloomy Prospect Blog, 1 November 2024. Available online: link to the article (accessed on 20 February 2025).
- Turkheimer, E.; Harden, K. P. Controversy requires competence: Comment on Rindermann et al. (2024). Journal of Controversial Ideas 2024, 4(2), 15. [Google Scholar] [CrossRef]
- Urbaniok, F. Schattenseiten der Migration. Zahlen, Fakten, Lösungen. [The dark side of migration. Facts, figures, solutions.]; Voima, 2025. [Google Scholar]
- Wasserstein, R. L.; Schirm, A. L.; Lazar, N. A. Moving to a world beyond “p < 0.05”. American Statistician 2019, 73(sup1), 1–19. [Google Scholar] [CrossRef]
- Wellman, W. C. H. Intelligence and immigration. Journal of Controversial Ideas 2024, 4(2), 14. [Google Scholar] [CrossRef]
- Whiting, D.; Lichtenstein, P.; Fazel, S. Violence and mental disorders: A structured review of associations by individual diagnoses, risk factors, and risk assessment. Lancet Psychiatry 2021, 8(2), 150–161. [Google Scholar] [CrossRef] [PubMed]
- Woodley, M. A. Inbreeding depression and IQ in a study of 72 countries. Intelligence 2009, 37, 268–276. [Google Scholar] [CrossRef]
- Woodley, M. A.; Bell, E. Consanguinity as a major predictor of levels of democracy: A study of 70 nations. Journal of Cross-Cultural Psychology 2013, 44(2), 263–280. [Google Scholar] [CrossRef]
| 1 | Following the reviewers’ suggestions, we now use the term “ancestry” instead of “evolution” (indicated by country-level skin lightness and cranial size). In this context, ancestry is not an alternative term for “race” (a categorical classification), but refers to genetic-evolutionary background, without implying specific assumptions about single traits such as genes for body size. |
| 2 | Original values as reported: natives (pupils without an immigration background) M = 521 SASQ (Student Assessment Scale Quotient) and SD = 91, pupils with both parents from Arab countries M = 400 SASQ. Conversion: or more appropriate: . In recent IQB (Institute for Educational Quality Improvement, Germany) reports, no student achievement test results could be found for students from Arab countries, although such results were presented in earlier ones. |
| 3 | When brain size is taken into account, the meaning also shifts: brain size is not only an ancestry marker, but also a causal factor for intelligence. |
| 4 | I would like to thank Professor Federico León, Lima, for sending me the data (genetic distances to South Africa based on Spolaore & Wacziarg, 2009). |
| 5 | In this data set, Mauritania was the most genetically similar country to Ethiopia, ahead of Djibouti, Eritrea and Somalia, which is implausible. However, this does not play a role in the analyses here. Both datasets lacked information on genetic distance for Palestine. This was estimated using data (mean) from Jordan (triple weighted), Egypt, Lebanon and Syria. |
| 6 | In recent decades, economics has increasingly used genetic data and theories to explain differences in wealth. For example, Ashraf and Galor (2018, p. 1119) in “an overview of the literature on the macrogenoeconomics of comparative development” spoke about the “significance of evolutionary processes and human population diversity in generating differential paths of economic development across societies”. |
| 7 | Turkheimer (2024) in a Substack comment: “They proudly announced they had conducted a ‘factor analysis’ of the two variables. For the uninitiated: it is not possible to conduct factor analysis of two variables. This is not an esoteric statistical point. Everyone knows it: I would immediately return a first-year graduate student paper if it included such a ridiculous error.” |
| 8 | The only difference is that the standard deviation of the g-factor is larger (SD = 1 vs. SD = 0.90). However, this is irrelevant for correlations. |
| 9 | I initially had three variables and kept the procedure for two variables. |
| 10 | The fit index SRMR for between is slightly worse with the variable genetic distance from Ethiopia than with the g-factor ancestry (SRMR = 0.090 vs. 0.064; Figure 2 vs. Figure 1 here). Mplus suggests a direct path from genetic distances to BOMAT-IQ. This would be βDenD = 0.66, the effect of country’s cognitive ability level decreases from βCA = 0.79 to βCA = 0.28. SRMR between is now 0.035. This would mean an increase of the possible genetic effect. However, the warning messages come back—probably too many parameters again. In future analyses with larger samples, control variables such as geographical distance should be added. |
| 11 | Multilevel path analysis with no variables at the country level. Fit-indices: CFI = .999, SRMR = .045 within (0.000 between). |
| 12 | Also see Turkheimer (2024) on a Substack comment: “Yes, desperate immigrants get lower scores on tests requiring them to complete abstract matrices in their head. Go figure. You don’t need a well-done factor or path analysis to tell you that.” See also below the discussion of a similar objection by Hillier-Smith (2024). |
| 13 | Kapur and McHale (2005, p. 97): “Successful institutional development generally depends on having a critical mass of individuals with high levels of human capital. They are certainly crucial in the initial stages of institutional development.” |
| 14 | Kapur & McHale (2005, p. 5): “The prospect of exit via emigration, for example, can increase the bargaining power of productive citizens compared with their more predatory brethren, in effect forcing the latter to give value creators better deals in such forms as lower taxes, smaller bribes, and better public sector working conditions.” |
| 15 | Hillier-Smith (2024, p. 13): “No asylum system in the world takes (or is permitted to take) IQ or prospective economic contributions as relevant in determining asylum cases. Rather, the only criteria that are relevant are the extent and severity of the threats to refugees’ lives, human rights, and basic needs from which they require protection, and their immunity from being further endangered and subjected to such threats.” |
| 16 | From Rindermann (2018, p. 289, slightly improved linguistically): The correlation between countries-of-origin’s and emigrants’ average ability level (e.g., Albanians in Albania vs. Albanians in Austria, Greece and Switzerland) without three outliers is r = 0.51, with outliers r = 0.23 (N = 35). The outliers are India (emigration of a highly selected well-educated elite), South Africa (white flight to Australia and New Zealand) and Nigeria (special case of well-educated and highly selected emigration to Ireland). For a small country sample of six countries we have both data for emigrants and immigrants: There is a closer relationship between home country’s and their emigrants’ level (β = 0.59, N = 6) than between receiving country’s and their immigrants’ level (β = 0.34, N = 6). Another study with second-generation migrant students born in Norway and from 47 countries of origin found a correlation of r = 0.69 between country-of-origin IQ and mathematics test performance in secondary school (Kirkegaard, 2023). The correlation may be slightly increased because only data adjusted for parental background characteristics such as education were available. Further indirect evidence comes from studies that relate country-of-origin IQ to economic success in the country of immigration (e.g., Jones & Schneider, 2010). |
| 17 | See also above the discussion of a similar objection by Turkheimer & Harden (2024). |
| 18 | Syria was the country with the most observations from the Arab-Muslim world in the BOMAT testing, and Eritrea was the country with the most observations from sub-Saharan Africa (Rindermann et al., 2024, Table 3). |
| 19 | Conversion: Great Britain as a benchmark IQ 100 (Altinok: 535, Gust: 503), standard deviation of student assessment studies converted to IQ scale (Altinok for 150 countries from SASQ = 74 into IQ = 11, Gust for 159 countries from 83 into 12). The results in both collections for Syria (IQ 84, Gust no data) and Eritrea (Altinok and Gust no data). The exact division into cultural regions is of course debatable. The best country in the Arab-Muslim world is Turkey (IQ 93, 94), in sub-Saharan Africa Botswana (IQ 82, Altinok) or Kenya (IQ 83, Gust). The original results from the two studies (in student assessment scale, SASQ, M = 500, SD = 100; first Altinok, then Gust): Egypt (387, 361) and Jordan (IQ 414, 415) or Nigeria (IQ 318, 297) and Ethiopia (IQ 371, 289). The regional averages are SASQ 405 and 379 for the Arab-Muslim world and SASQ 347 and 301 for sub-Saharan Africa; Syria in Altinok SASQ 430. The best country in the Arab-Muslim world is Turkey (SASQ 486, 461), in sub-Saharan Africa Botswana (SASQ 412, Altinok) or Kenya (IQ 387, Gust). |
| 20 | If migrants arrive after their childhood, these childhood costs are eliminated; however, in this case, higher costs often arise later due to language and educational (competence) deficits. |
| 21 | Figures reprinted with permission. |
| 22 | Hillier-Smith (2024) rightly pointed to very positive examples of immigration that were favorable for the host country. Well known examples are: French Huguenots in Germany (Hornung, 2014); Jewish emigrants from Nazi Germany in the USA (Moser et al., 2014). |
| 23 | link to the article (5 February, 2025). |
| 24 | Peter Singer (2024, translated with the help of DeepL). |
| 25 | “It has been long- and well-established that all persons have equal moral worth” (Hillier-Smith, 2024, p. 6). |
| 26 | E.g., link to the article. Where available, English-language Wikipedia pages are used in this article. Wikipedia is considered to be rather left-wing (e.g., Tezuka, 2022). |
| 27 | Nothing is controversial in itself, but is labeled as controversial by certain groups with certain intentions (Rindermann, 2023). |
| 28 | One example is that of The Fire Raisers (Biedermann und die Brandstifter, Max Frisch, 1953), another one An Old Manuscript (Ein altes Blatt, Franz Kafka, 1920) or the controversialized Camp of the Saints (Le Camp des Saints, Jean Raspail, 1973). Perhaps readers know of other early texts that are maybe even too controversial to be listed here. |
| 29 | |
| 30 | A distinction must be made here between the modern-woke and the classic left. For Voltaire (e.g., Mahomet) or Marx (e.g., Critique of Hegel’s Philosophy of Right), for example, Islam was reactionary. In Germany today, Hartmut Krauss is part of this tradition of thought. |
| 31 | www.youtube.com/watch?v=sgSaYCq6_WE&ab_channel=ZDFheuteNachrichten (Translated with the help of DeepL, 13 February, 2025, minute 2:15) A systematic investigation of such appeasements and twists in science, media and politics can be found in Urbaniok’s (2025) work, which compares data from Germany, Austria and Switzerland. |
| 32 | link to the article (12 March, 2019), link to the article. |
| 33 | This also corresponds to the Christian concept of Ordo amoris, which goes back to Paul, Augustine and Thomas Aquinas, for example: “Anyone who does not provide for their relatives, and especially for their own household, has denied the faith and is worse than an unbeliever” (1 Timothy 5:8). |
| 34 | The beginning of the oath of office of the Federal Chancellor in Germany: “I swear that I will dedicate my efforts to the well-being of the German people, promote their welfare, protect them from harm ...” |
| 35 | E.g., link to the article (20.02.2025). |
| 36 | E.g., link to the article (20.02.2025). |
| 37 | E.g., link to the article (20.02.2025). |
| 38 | E.g., link to the article (20.02.2025). |
| 39 | E.g., link to the article (20.02.2025). |
| 40 | E.g., link to the article (23.10.2023). |
| 41 | E.g., link to the article (Translated with the help of DeepL, names omitted, 02.08.2019). |
| 42 | E.g., link to the article (27.08.2017), link to the article (20.03.2019). |
| 43 | E.g., link to the article (11.02.2025). |
| 44 | E.g., link to the article (13.05.2024). |
| 45 | E.g., link to the article (20.02.2025). |
| 46 | E.g., link to the article (24.08.2024). |
| 47 | E.g., link to the article (20.02.2025). |
| 48 | E.g., link to the article (20.07.2023), link to the article (07.10.2024). |
| 49 | E.g., link to the article (24.10.2023). |
| 50 | link to the article (4.10.2023). |
| 51 | link to the article (07.03.2024). |
| 52 | link to the article (Translated with the help of DeepL, 18.01.2025). |
| 53 | link to the article (25.10.2024). |
| 54 | E.g., link to the article (11.02.2025), link to the article (26.10.2017). |
| 55 | E.g., link to the article (28.01.2025). |
| 56 | link to the article (23.02.2024). |
| 57 | link to the article (Translated with the help of DeepL, 15.12.2022). |
| 58 | E.g., link to the article (16.05.2017), link to the article (31.01.2017). |
| 59 | E.g., link to the article (22.03.2016). |
| 60 | E.g., link to the article (21.02.2019). |
| 61 | link to the article (08.06.2017). |
| 62 | link to the article (Translated with the help of DeepL, 29.01.2025). |
| 63 | link to the article (26.07.2016); link to the article (03.07.2016). |
| 64 | E.g., link to the article (28.01.2025). |
| 65 | link to the article (Translated with the help of DeepL, 26.09.2024). |
| 66 | link to the article (20.02.2025); link to the article (04.12.2016); link to the article (12.03.2019). |
| 67 | link to the article (15.02.1015). |
| 68 | link to the article (18.10.2024). |
| 69 | The numbers are based on Bundeskriminalamt (2024, p. 7, number of refugees) and Bundesministerium des Innern (2024, p. 14, numbers of suspects for different delicts). The numbers on the size of the total population and migrants come from Destatis (February 15, 2025). Calculation was carried out by ourselves. Reference is made to the usual problems: Reporting behavior, suspects are not convicted persons, emigration and immigration in one year, tourists, in the group of German citizens there are persons with a migration background and dual nationals, immigrants and refugees are on average younger, among refugees there is a higher proportion of men. |
| 70 | Marie and Pinotti (2024, p. 185): The incarceration rate of immigrants “is 2 times higher than that of natives on average across these [Western] countries, up to 3 times higher in Austria and Denmark, and 4.5 times higher in Greece.” In the report on Germany by Adema and Alipour (2025), the factor over the last 14 years is approximately 3.0, i.e., migrants have a three times higher burden in general crime (suspect rate). |
© 2025 Copyright by the author. This article is an open access article distributed under the terms and conditions of the Creative Commons Attribution (CC BY) license (https://creativecommons.org/licenses/by/4.0/).